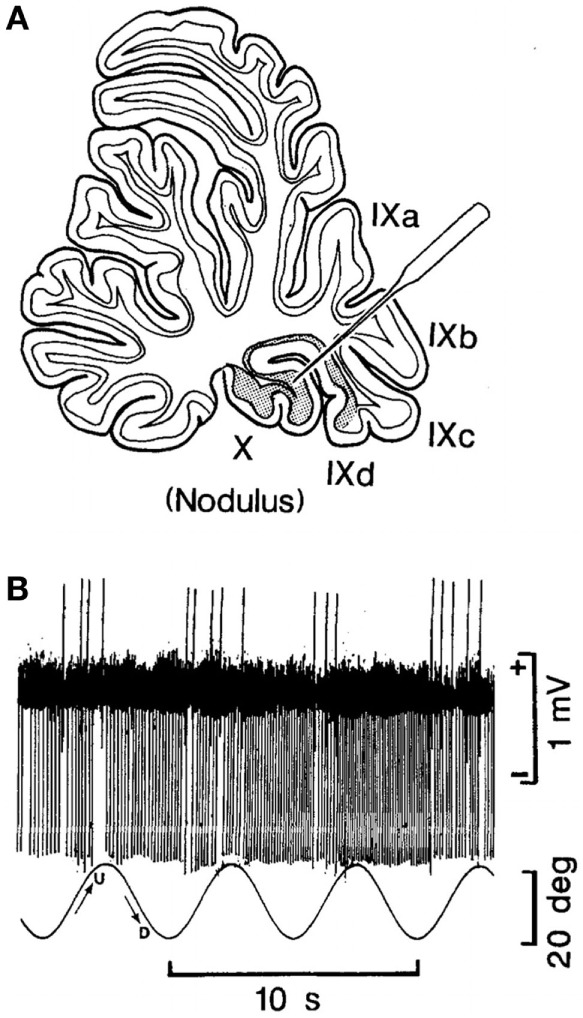
Figure 2.

(A) Site of recording of the neuron of the nodulus shown in (B). (B) Climbing Fiber-driven Purkinje cell activity from the site shown in (B). The Purkinje cell fired three to five times. Each time, the animal was rolled into the left side-down position. The oscillation in roll is shown by the bottom trace. The oscillation amplitude is shown by the bar on the right, and the time base by the lowest trace. This figure is reprinted with permission. For further details, see the article by Barmack and Shojaku (70).
