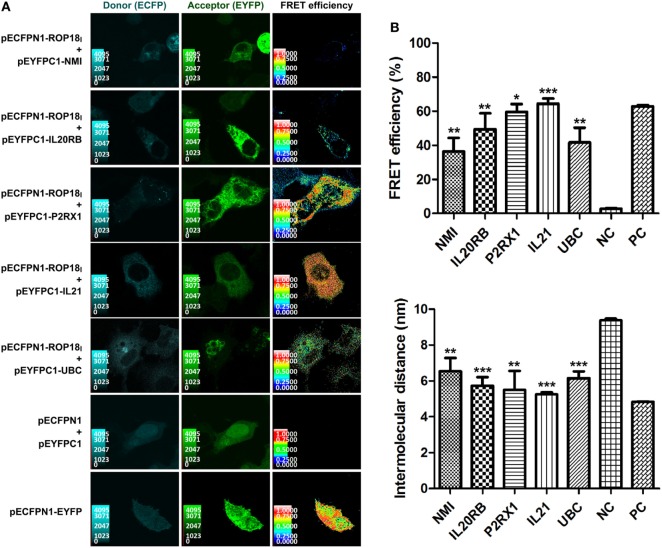
Figure 2.
Validation of the TgROP18-interacting proteins by SE-FRET assay. (A) Co-localization and FRET interaction of ROP18I with NMI, IL20RB, P2RX1, IL21, and UBC. Localization and co-localization of ROP18I and the five indicated candidates are shown in the donor channel (column 1) and the acceptor channel (column 2), respectively. The FRET efficiency is shown in column 3, in which a thermal pseudo color-matched FRET signal intensity scale is indicated for each image. (B) Quantitative analysis of FRET efficiency and intermolecular distance between ROP18I and the five indicated candidates. Error bars represent the means ± SD of triplicates. Student’s t-tests results are between the six experimental groups and NC, *p < 0.05; **p < 0.01; ***p < 0.001. Abbreviations: NC, negative control; PC, positive control.

