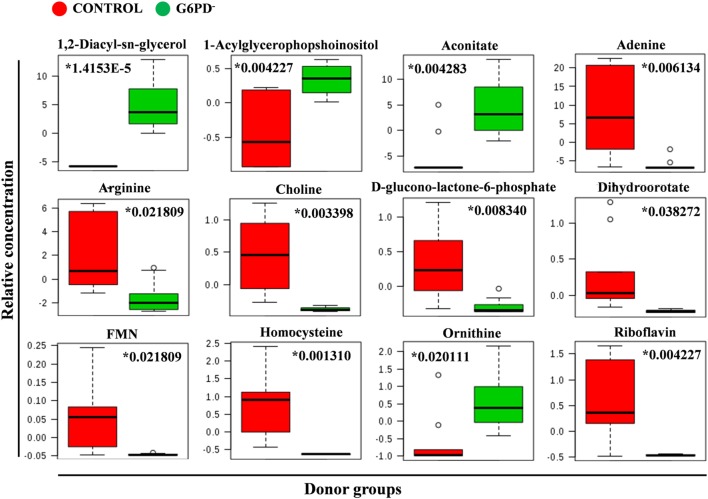
Figure 5.
Quantitative assessment of selected metabolites. Box and whisker plots for selected significantly altered metabolites in G6PD− FFP compared with control (units in normalized and scaled concentrations). The x-axis shows the specific metabolite and the y-axis is the relative concentration. Medians are indicated by horizontal lines within each box. Outliers are plotted as individual points. Numbers with asterisks indicate adjusted p-values.

