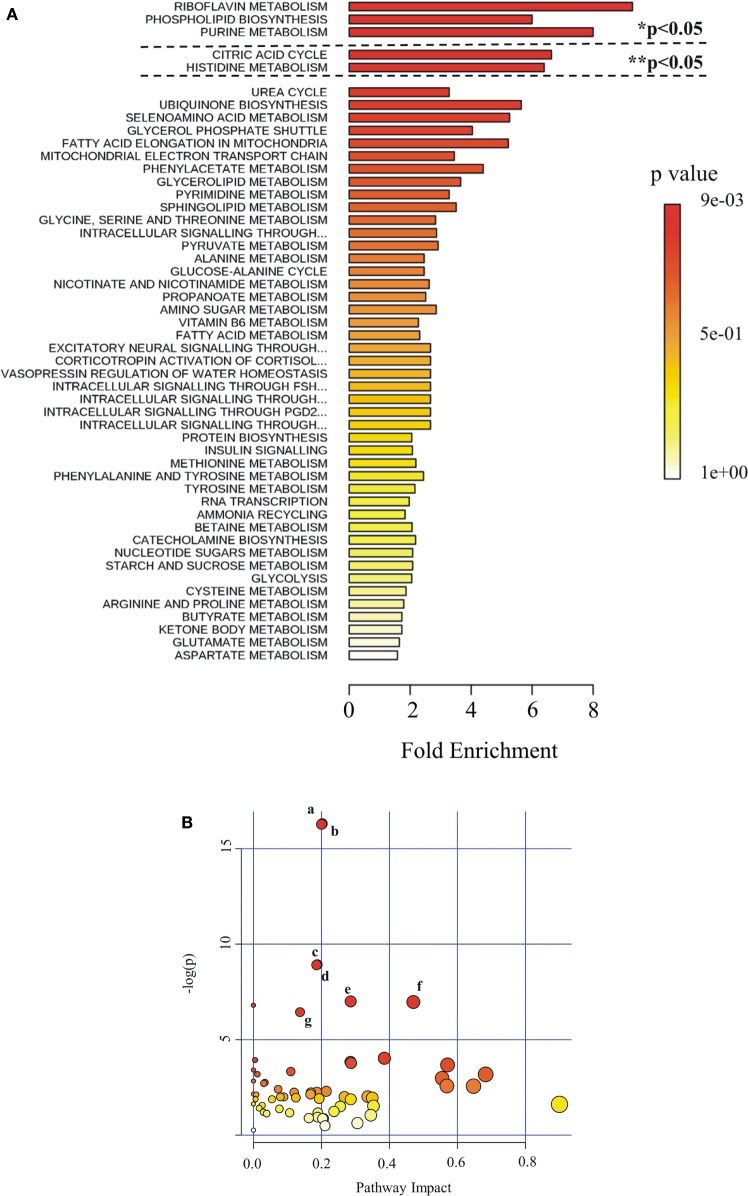
Figure 6.
Pathway analysis as generated by MetaboAnalyst software package. Identified metabolites and their relative quantity were used to calculate the enrichment and statistical significance. (A) Metabolite set enrichment analysis (MSEA). Top 50 perturbed pathways are shown. The dashed lines indicate the cutoff of the adjusted p-value (*Holm; ** FDR). (B) Metabolic pathway analysis (MetPA). All the matched pathways are displayed as circles. The color and size of each circle are based on p-value and pathway impact value, respectively. The most impacted pathways having high statistical significance scores are indicated with letters: a, glycerolipid metabolism; b, glycerophospholipid metabolism; c, purine metabolism; d, riboflavin metabolism; e, glyoxylate and dicarboxylate metabolism; f, tricarboxylic acid cycle; g, inositol phosphate metabolism.

