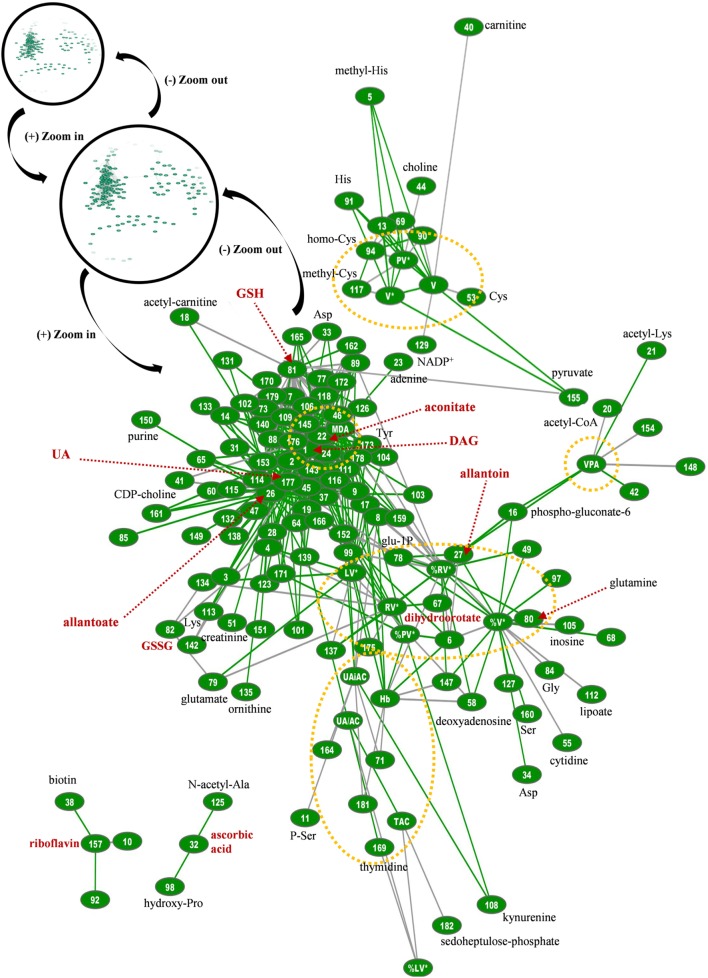
Figure 8.
Topological presentation of correlations between biochemical, physiological and metabolomic variables in G6PD− fresh frozen plasma (FFP) units. Starting from the total G6PD− network (shown in black circles) and by using continuous “zoom in” tools we studied the main connections between redox, EVs, and metabolic parameters. This subnetwork was bigger and quite different compared with that of control FFP. It consisted of 434 connections (see Table S1 in Supplementary Material for code numbering and abbreviations), and while uric acid is also a hub node, diacylglycerol (DAG), lipid peroxidation (MDA), allantoate, aconitate, and reduced glutathione (GSH) have substantially more connections. The red dashed arrows indicate metabolites of high connectivity, and the yellow dashed circles stand for “boxes” of distinct groups of interconnected variables that correspond to the core of the network, FFP EVs, and antioxidant capacity. Only the statistical significant correlations at p < 0.05 are shown. The length of each line is inversely proportional to the r value of the correlation (the shorter the edge, the higher the r value). Green lines: positive correlations; Gray lines: negative correlations.

