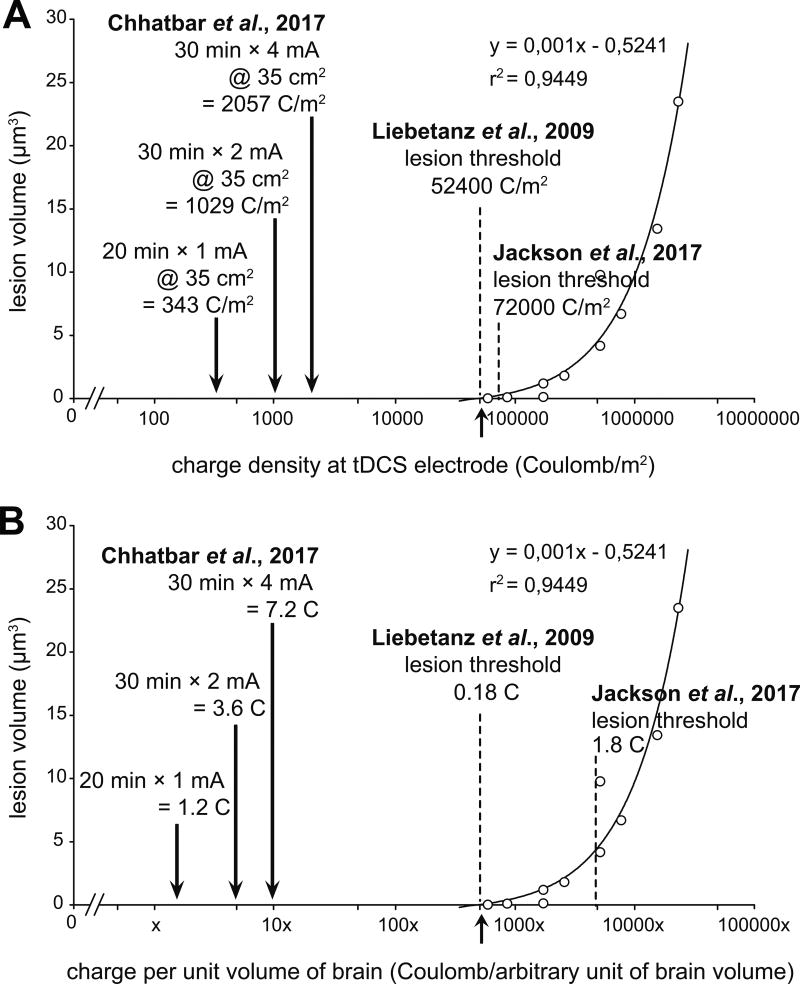
Figure 1. Jackson et al. 2017 actually shows higher safety threshold than previously reported by Liebetanz et al. 2009.
(A) Charge density plot. (B) Charge delivery per unit volume of the brain (arbitrary, assuming 2000× human to rat brain volume ratio - the total charge delivered to the human brain per unit volume is much smaller when compared with the rat brain.) Note the logarithmic scale on the azimuth in both the plots (from Chhatbar et al.4).

