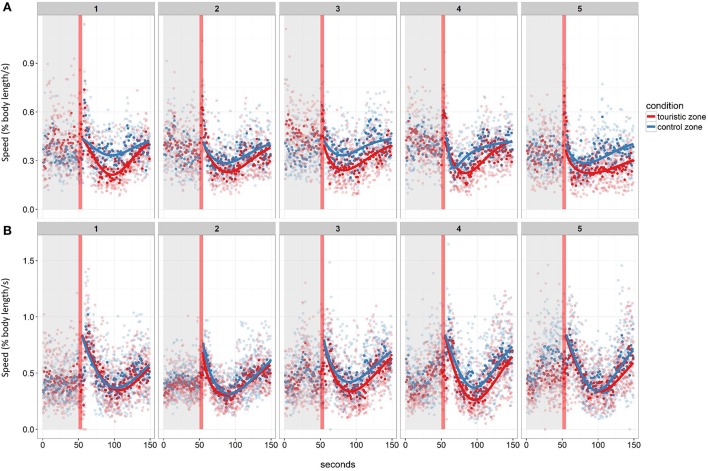
Figure 8.
Mean swimming speed before and after the stressor (red vertical line) of fish from the control or touristic zone throughout the five experimental days in the two replicates of the study in June (A) and August (B). Mean values per tank are given (n = 4 in June, n = 6 in August). The post-stressor period was modeled for each tank and each day using a Weibull curve.

