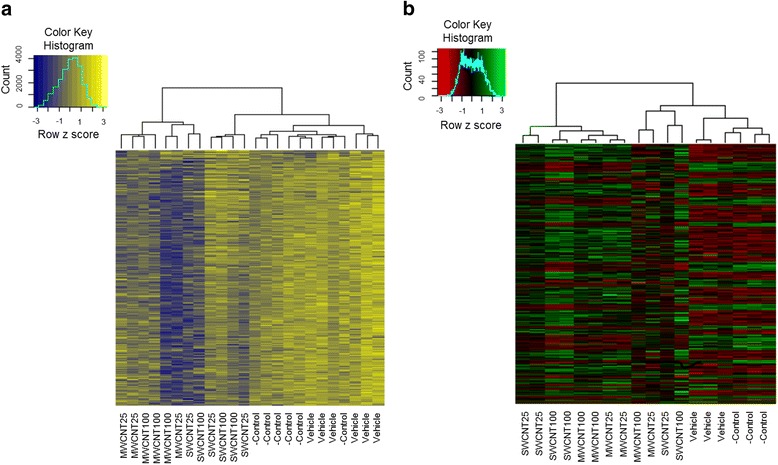
Fig. 5.

Hierarchical cluster analysis and heat-map to detect differential methylation and expression. The heatmap demonstrates (a) differential methylation level ranging between blue and yellow hypomethylation to hypermethylation, respectively) and (b) differential expression level ranging between green and red (upregulation to downregulation, respectively) of a substantial number of genes in the MWCNT-treated, SWCNT-treated and untreated [control (only cell culture medium), vehicle (cell culture medium with dispersion medium)] cells. Clustering (based on z scores) of the samples are depicted using the dendrograms at the top of the heatmaps. Different samples names are indicated at the bottom of the heatmaps. Histograms at the top left represent the colour scale reflecting methylation differences and expression differences. 25 and 100 represents exposure concentrations as μg/ml
