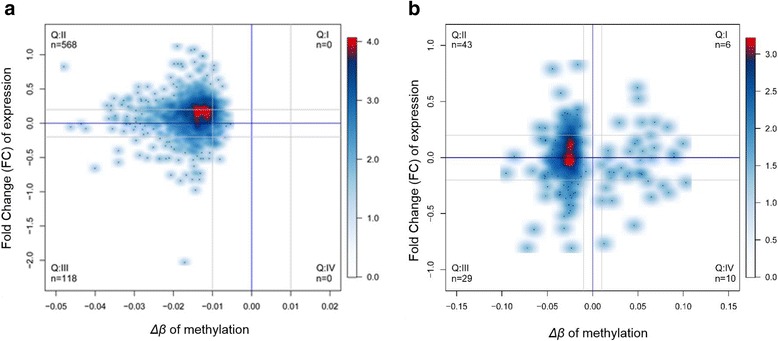
Fig. 6.

Integrated analysis of gene expression and DNA methylation changes in CNTexposed 16HBE cells. Analysis of gene expressions with significant differential methylation: (a) using genes with differentially methylated gene promoters after exposure to MWCNTs and (b) using genes with differentially methylated CpG sites after exposure to SWCNTs. log2FC in mean gene expression are plotted against mean Δβ values of individual CpGs and gene promoter regions between CNT-exposed and control samples. Densities of values are plotted by using a color scale from light blue (low density) to red (high density). Gray lines indicate relative hypomethylation and hypermethylation (Δβ > 0.01 or Δβ < − 0.01) or relative increase and decrease (log2FC > 0.2 or log2FC < 0.2) in gene expression. In quadrant Q I, genes are relatively hypermethylated after CNT-exposure and show increased gene expression [(A) N = 0, (B) N= 6]; Q II, genes are relatively hypomethylated after CNT-exposure and show increased gene expression [(A) N= 568, (B) N = 43]; Q III, genes are relatively hypomethylated after CNT-exposure and show decreased gene expression [(A) N= 118, (B) N= 29]; Q IV, genes are relatively hypermethylated after CNT-exposure and show decreased gene expression [(A) N = 0, (B) N = 10]
