
Fig. 9.
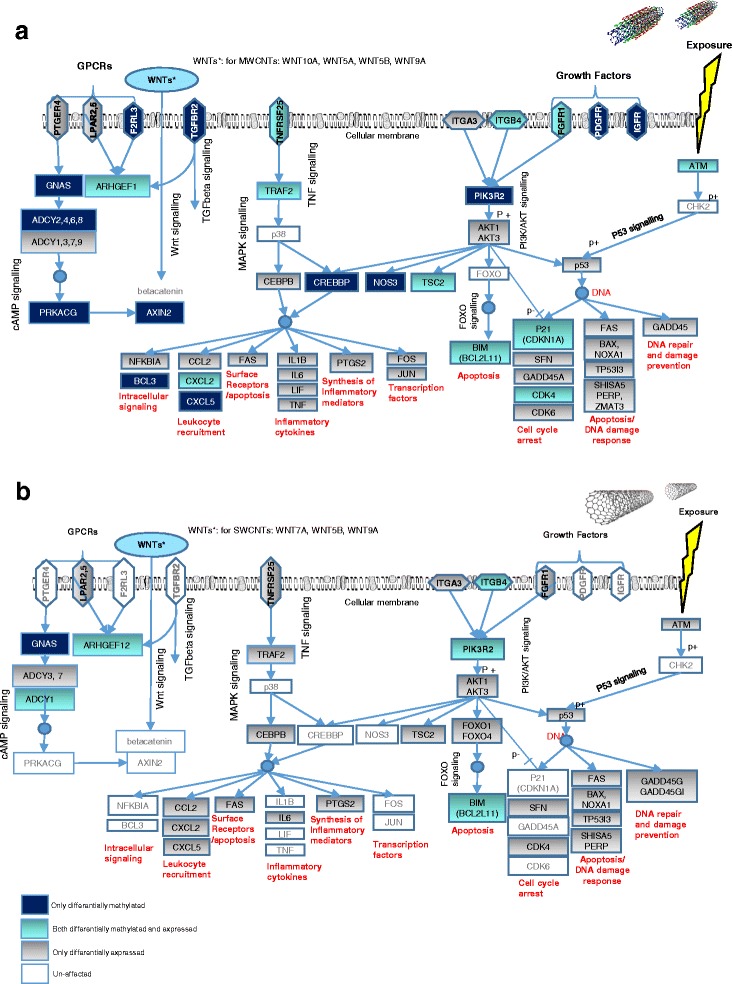
An overview of functionally altered pathways. The diagram demonstrates the functionally altered cell signalling pathways after exposure to a MWCNTs and b SWCNTs. The grey coloured boxes which consist the differentially expressed genes, the dark blue colour indicates only differentially methylated genes, turquoise blue colour indicates both differentially methylated and expressed genes within the mentioned pathways. Genes that are written in white boxes are unaffected. Blue circles indicate DNA. ‘p+’ and ‘p-’ indicate phosphorylation and de-phosphorylation, respectively