Fig. 2.

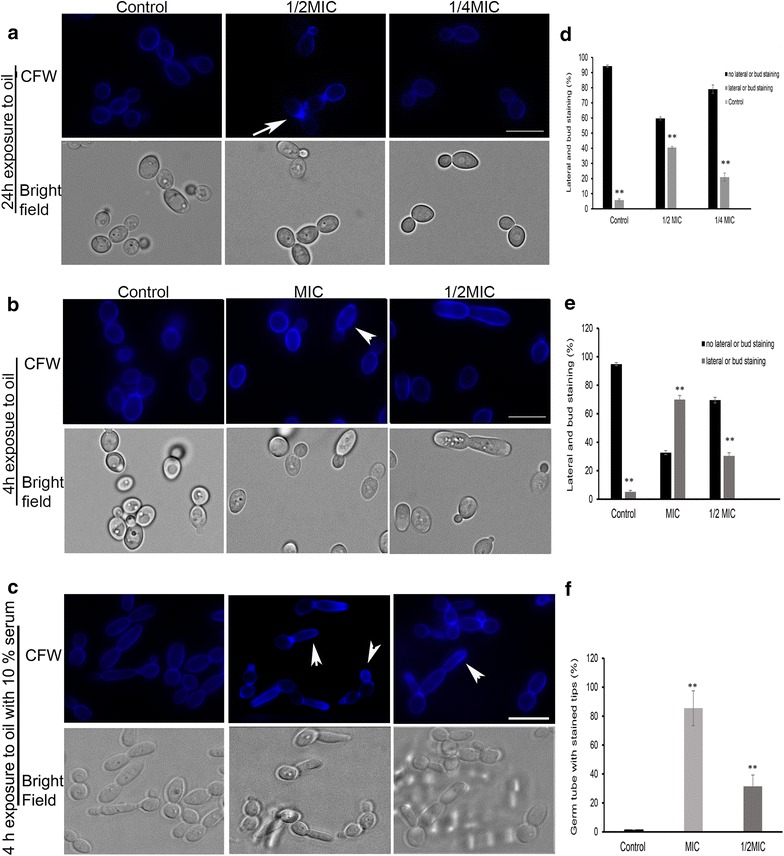
CNB oil exposure induces a cell wall stress response with altered chitin distribution in RSY150. Epifluorescence (top panel) and bright field (bottom panel) images of CFW stained cells. Cells were grown in YPD in (a) and (b) while cells in (c) were grown in YPD plus 10% serum for hyphal induction. a RSY150 cells were incubated for 24 h with and without 1/2 and 1/4 MIC CNB oil in YPD media and stained with CFW. b Mid log phase RSY150 were exposed to MIC and 1/2 MIC for 4 h stained with CFW and imaged. c Cells grown in YPD with 10% serum were exposed to the same concentration as in (b) for 4 h, stained with CFW and imaged. (d, e, f) are bar graphs showing enumeration of cells in (a, b and c) respectively, where double asterisks indicate p < 0.05. Bars = 5 μm
