
Fig. 2.
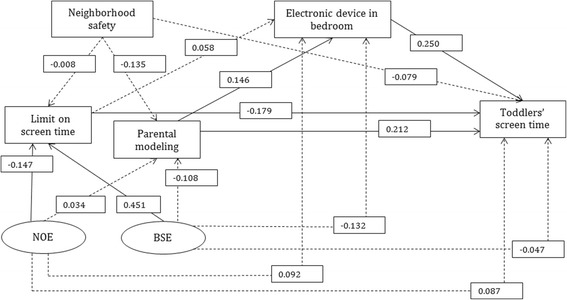
The SMCB hypothesized screen time model (n = 193). Note: All solid line parameters are within 95% credible intervals; dashed line parameters are not within 95% credible intervals. Ovals represent latent constructs and rectangles represent measured variables. Only standardized beta coefficients are presented and the error terms, covariates, 95% credible intervals and measurements are not presented for clarity. Analysis was adjusted for toddler’s age, sex, race/ethnicity, main childcare type and household income. NOE: Negative outcome expectations; BSE: Barrier self-efficacy