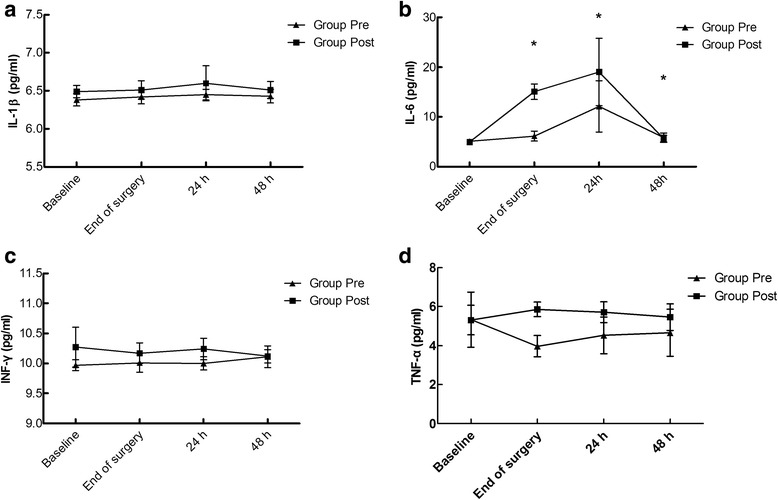
Fig. 3.

Comparison of the plasma concentrations of IL-1β (a), IL-6 (b), IFN-γ(c), and TNF-α (d) between the two groups. a Pgroup = 0.048, Ptime = 0.285, and Pgroup-time interaction = 0.865. b Pgroup, Ptime, and Pgroup-time interaction < 0.001. #P < 0.001 vs. baseline. c Pgroup < 0.001, Ptime = 0.949, and Pgroup-time interaction = 0.120. d Pgroup = 0.003, Ptime = 0.325, and Pgroup-time interaction = 0.298
