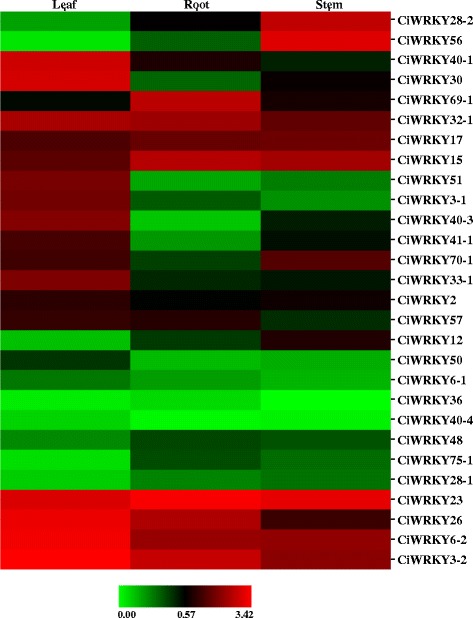
Fig. 4.

Expression profiles of CiWRKY genes in different tissues. Samples were collected from the roots (R), stems (S) and leaves (L) of C. intermedia. The transcripts of 28 CiWRKYs with full-length sequences were examined via qRT-PCR. The relative expression values were calculated using the 2-ΔCT method, and CiEF1α was employed as the endogenous control. The 2-ΔCT-based expression values were used to produce the heatmap
