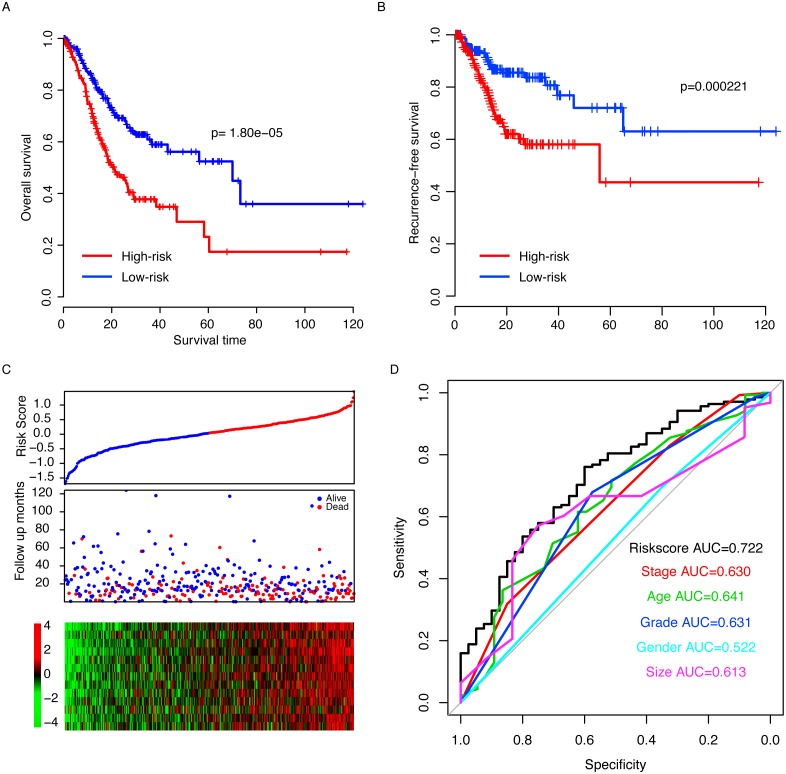
Figure 2. Risk score in the TCGA dataset.
The high-risk group had a significantly longer overall survival (OS) time than low risk group (A), and a similar pattern was observed for recurrence-free survival (RFS, B). The detailed survival information of samples, risk score and gene expression (C) and three-year survival ROC were also calculated (D).

