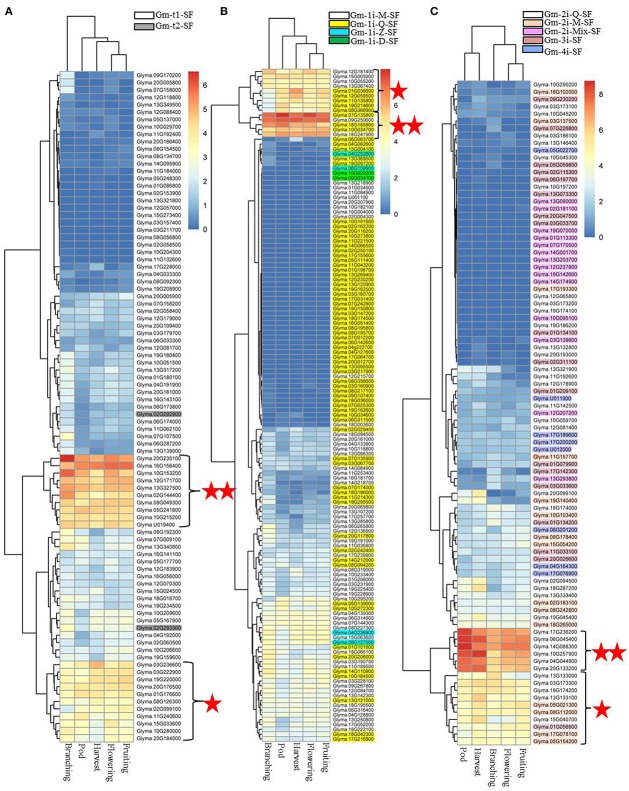
Figure 6.
RNA-seq analysis of 321 soybean C2H2-ZFPs in soybean nodules at five important developmental stages. Heatmaps were produced based on our RNA-Seq results using the pheatmap packages in R. The description of these five important developmental stages (branching stage, flowering stage, fruiting stage, pod stage, and harvest stage) were shown in our previous research (Yuan et al., 2017). “⋆⋆”indicates the clustering branches of genes were expressed most abundantly in all or most of above-mentioned nodule samples. “⋆”indicates the clustering branches of genes were expressed high in nodule samples. (A) Heatmap for Gm-t1-SF and Gm-t2-SF genes. (B) Heatmap for Gm-1i-Q-SF, Gm-1i-M-SF, Gm-1i-Z-SF and Gm-1i-D-SF genes. (C) Heatmap for Gm-2i-Q-SF, Gm-2i-M-SF, Gm-2i-Mix-SF, Gm-3i-SF, and Gm-4i-SF genes.

