
FIGURE 3.
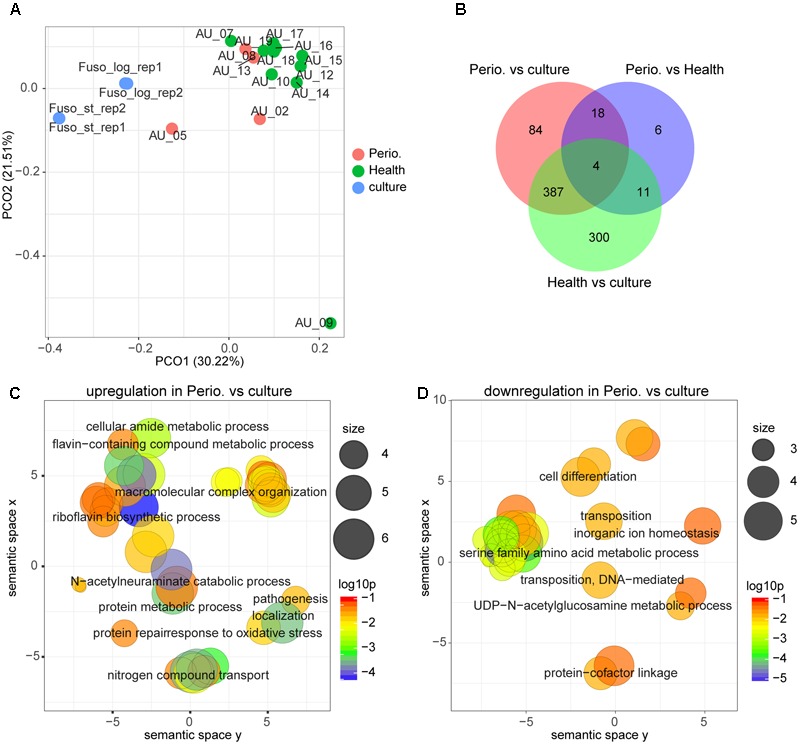
Comparison of the transcriptional profiles between periodontitis, health and laboratory culture for F. nucleatum. (A) PCoA of transcriptional profiles of Fusobacterium nucleatum in four periodontal pocket samples from patients with chronic periodontitis, 10 periodontal pocket samples from healthy individuals and four laboratory cultures at log or stationary phase. (B) Venn diagram showing the number of differentially expressed genes in each comparison. (C,D) GO terms up-regulated (C) and down-regulated (D) in periodontitis in comparison to laboratory culture. All GO terms with enrichment P-value ≤ 0.05 were summarized and visualized by REVIGO, and the size of the bubble indicates the number of merged terms.