
FIGURE 4.
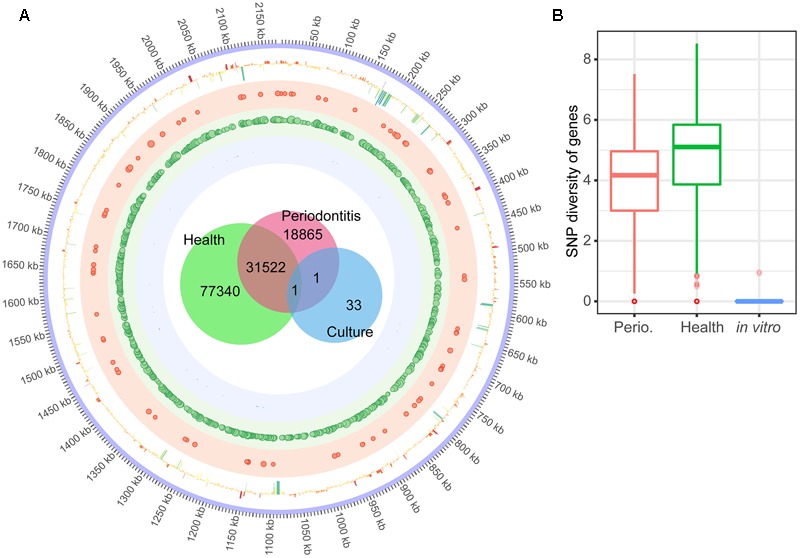
Single Nucleotide Polymorphisms (SNPs) in the transcriptome of F. nucleatum in the periodontal niche and in laboratory culture. (A) The innermost Venn diagram shows the number of SNPs of F. nucleatum transcripts in the periodontal community of individuals with periodontitis, without periodontitis, and laboratory culture. The circle shows the SNPs mapped to the genome of F. nucleatum. Size of the dots in the shaded red, green and blue circles illustrates the frequency (>50) of variants in a 1 kb window of F. nucleatum in periodontitis, health and laboratory culture, respectively. The outermost circle shows the log2FC of each gene in periodontitis compared to laboratory culture. (B) Frequency of SNPs per gene calculated as Shannon diversity (see Section “Materials and Methods” for details). The median, inter quantile range and outliers are shown in the boxplot.