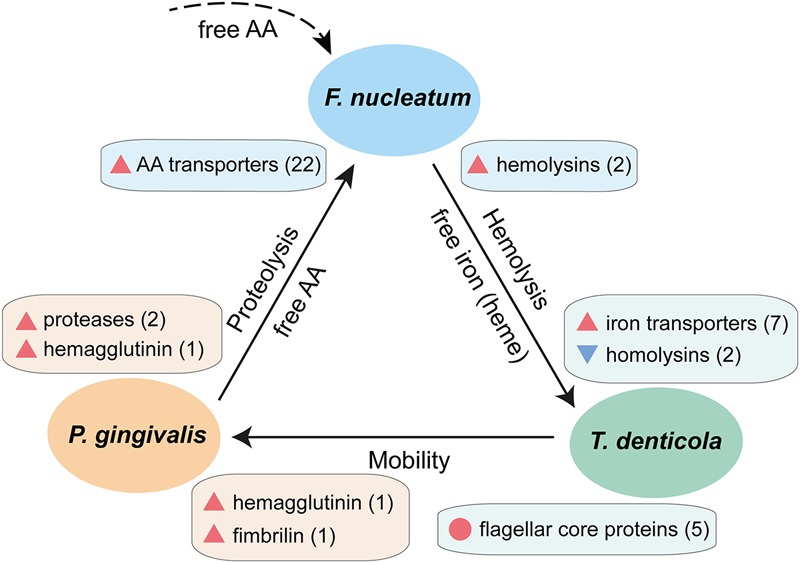
FIGURE 5.

Schematic interaction model showing synergistic pathogenicity of F. nucleatum, P. gingivalis, and T. denticola based on their transcriptional profiles in chronic periodontitis. Blue triangles denote down-regulation, red triangles up-regulation in vivo, the number in parentheses indicate the number of genes of this particular function, and the red circle denotes a set of genes which are highly expressed both in vivo and in laboratory culture. The dashed line indicates contribution of free amino acids by other members of the periodontal microbiota.
