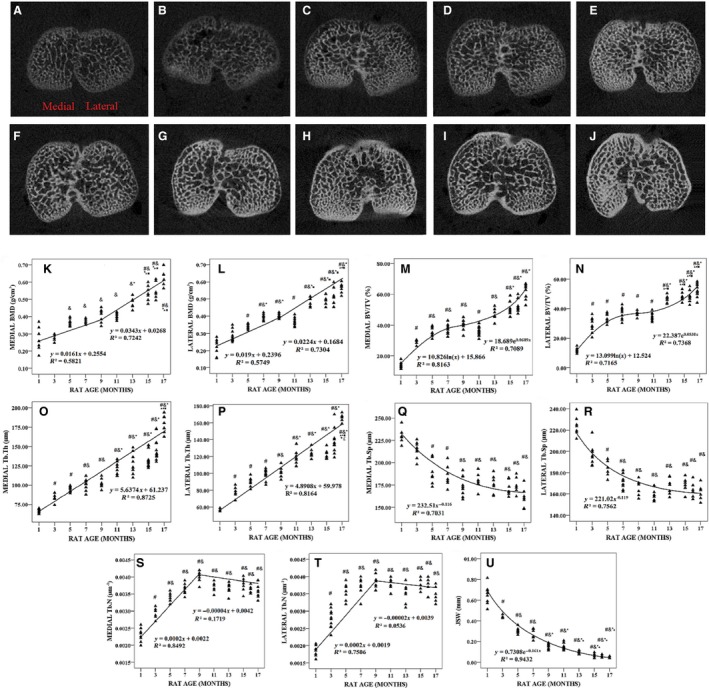
Figure 3.

Typical X‐ray micro‐tomography (XMT) images, bone mineral density (BMD) and microarchitecture parameters of tibial subchondral trabecular bone (ST) from 1‐, 3‐, 5‐, 7‐, 9‐, 11‐, 13‐, 15‐, 16‐ and 17‐month‐old rats (n = 100) and joint space width (JSW). (A–J) Typical XMT images from 1‐, 3‐, 5‐, 7‐, 9‐, 11‐, 13‐, 15‐, 16‐ and 17‐month‐old rats, respectively. (K) Medial BMD was plotted with animal age. (L) Lateral BMD was plotted with animal age. (M) Medial BV/TV was plotted with animal age. (N) Lateral BV/TV was plotted with animal age. (O) Medial Tb.Th was plotted with animal age. (P) Lateral Tb.Th was plotted with animal age. (Q) Medial Tb.Sp was plotted with animal age. (R) Lateral Tb.Sp was plotted with animal age. (S) Medial Tb.N was plotted with animal age. (T) Lateral Tb.N was plotted with animal age. (U) JSW was plotted with animal age. # P < 0.05, compared with 1‐month group; & P < 0.05, compared with 3‐month group; *P < 0.05, compared with 5‐month group; ▲P < 0.05, compared with 7‐month group; ●P < 0.05, compared with 9‐month group; ■P < 0.05, compared with 11‐month group; ◆ P < 0.05, compared with 13‐month group; £ P < 0.05, compared with 15‐month group.
