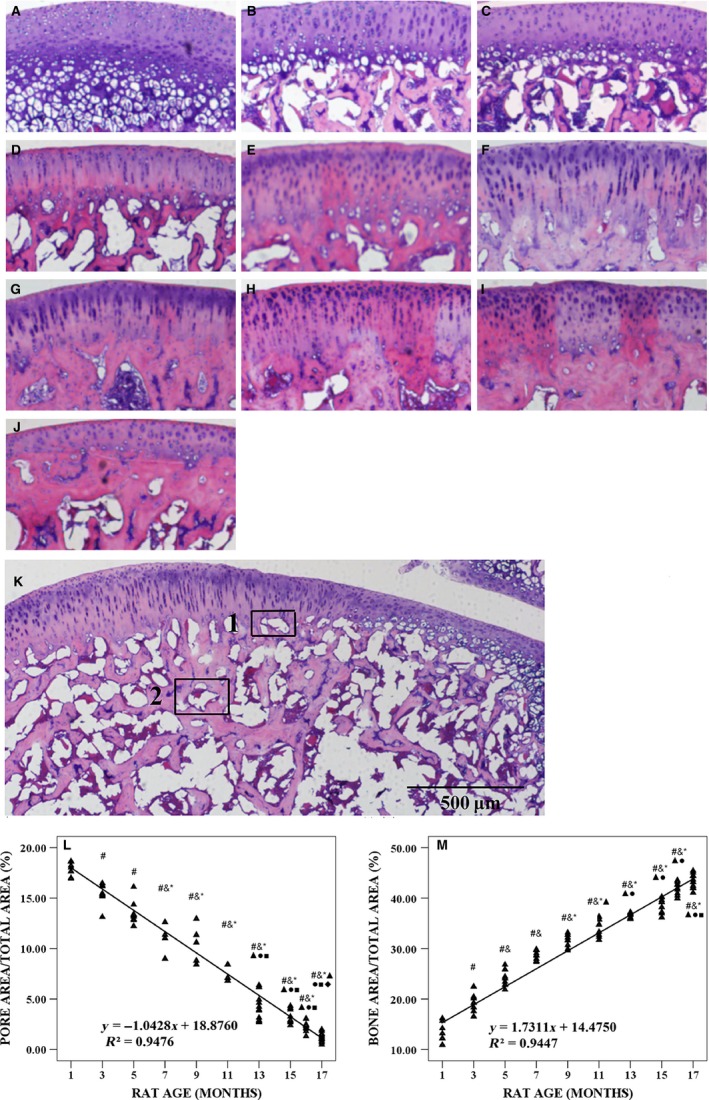
Figure 4.

Typical histology images with hematoxylin and eosin (HE) staining of articular cartilage (AC) in tibial plateau from 1‐, 3‐, 5‐, 7‐, 9‐, 11‐, 13‐, 15‐, 16‐ and 17‐month‐old rats, histological image of tibial plateau of female Wistar rats at the age of 7 months and quantitative analysis of the microarchitecture of trabecular bone in tibial plateau. (A–J) Typical histological images with HE staining from 1‐, 3‐, 5‐, 7‐, 9‐, 11‐, 13‐, 15‐, 16‐ and 17‐month‐old rats, respectively. (K) Typical image of pore area at osteochondral junction (tagged 1) and subchondral trabecular bone (ST) area of tibial plateau (tagged 2) at the age of 7 months. (L) Ratio of pore area/total area varied with animal age. (M) Ratio of bone area/total area varied with animal age. Bars represent a length of 500 μm. # P < 0.05, compared with 1‐month group; & P < 0.05, compared with 3‐month group; *P < 0.05, compared with 5‐ month group; ▲P < 0.05, compared with 7‐month group; ●P < 0.05, compared with 9‐month group; ■P < 0.05, compared with 11‐month group; ◆ P < 0.05, compared with 13‐month group.
