
Figure 5.
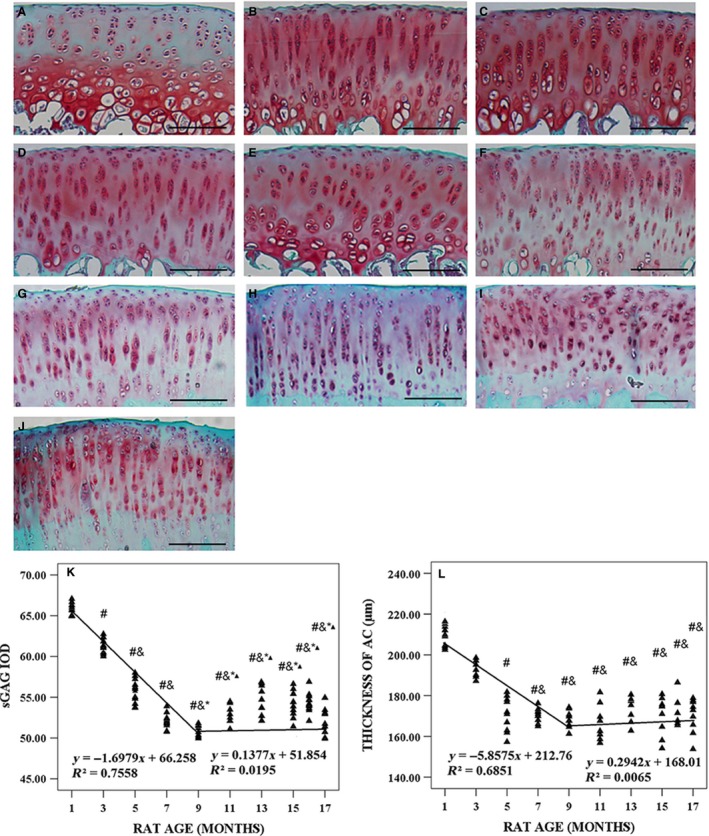
Typical histology images with Safranin O‐Fast Green of articular cartilage (AC) in tibial plateau from 1‐, 3‐, 5‐, 7‐, 9‐, 11‐, 13‐, 15‐, 16‐ and 17‐month‐old rats and microarchitecture parameters of AC in tibial plateau. (A–J) Typical histology images with Safranin O‐Fast Green from 1‐, 3‐, 5‐, 7‐, 9‐, 11‐, 13‐, 15‐, 16‐ and 17‐month‐old rats, respectively. (K) Sulfated glycosaminoglycan (sGAG) integrated optical density (IOD) varied with animal age. (L) Thickness of AC varied with animal age. Bars represent a length of 100 μm. # P < 0.05, compared with 1‐month group; & P < 0.05, compared with 3‐month group; *P < 0.05, compared with 5‐month group; ▲P < 0.05, compared with 7‐month group.