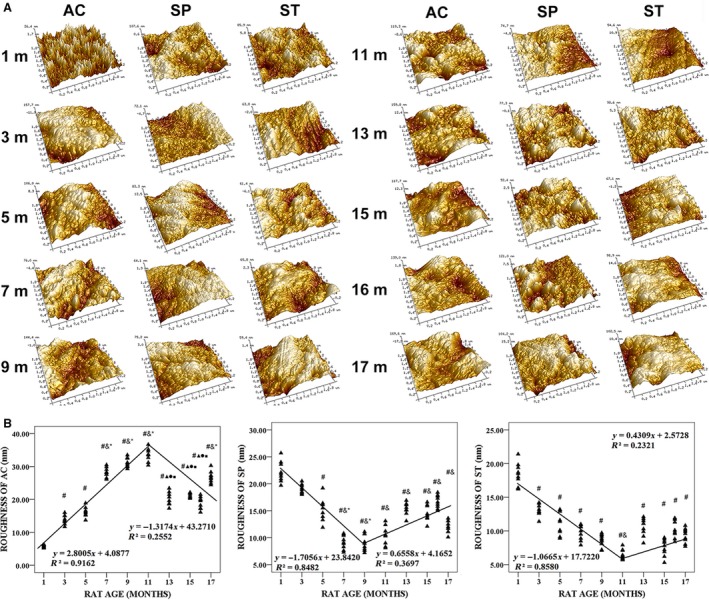
Figure 8.

Typical atomic force microscopy (AFM) topographic images (5 × 5 μm) and roughness of articular cartilage (AC) in tibial plateau, subchondral plate (SP) and subchondral trabecular bone (ST) from 1‐, 3‐, 5‐, 7‐, 9‐, 11‐, 13‐, 15‐, 16‐ and 17‐month‐old rats. (A) AFM topographic images varied with animal age. (B) Rougness varied with animal age. # P < 0.05, compared with 1‐month group; & P < 0.05, compared with 3‐month group; *P < 0.05, compared with 5‐ month group; ▲P < 0.05, compared with 7‐month group; ●P < 0.05, compared with 9‐month group; ■P < 0.05, compared with 11‐month group.
