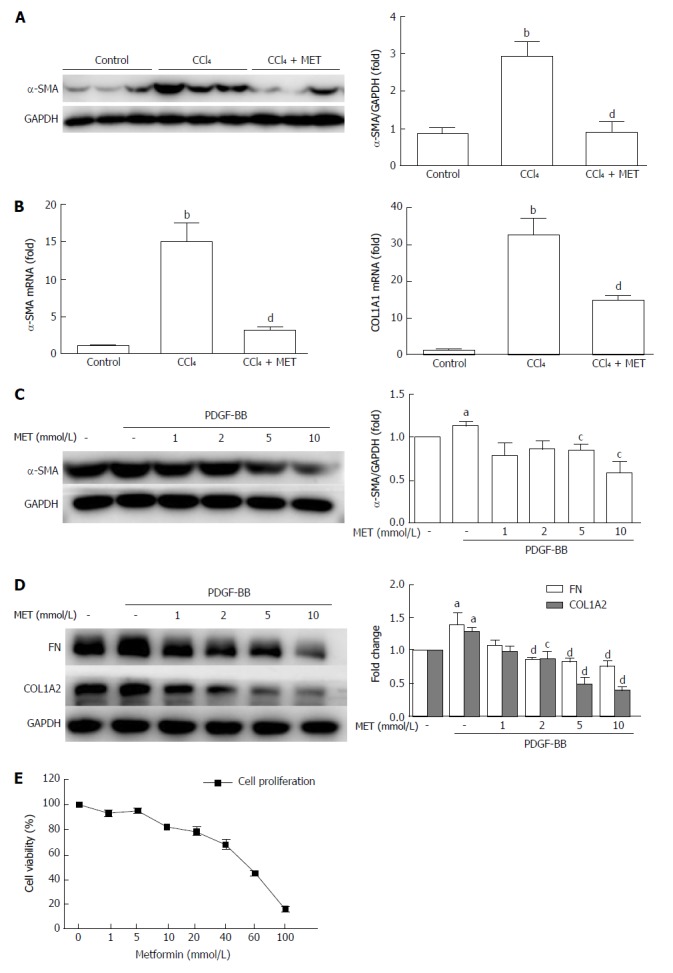
Figure 2.

Effect of metformin on the activation, proliferation, and extracellular matrix secretion of hepatic stellate cells. A: Measurement of α-SMA levels in murine liver tissues by Western blot; B: Measurement of hepatic α-SMA and collagen type I mRNA expression levels by quantitative real-time PCR (n = 5, bP < 0.01 vs the control group, dP < 0.01 vs the CCl4 group); C and D: HSCs were treated with or without 10 ng/mL PDGF-BB for 24 h, and the effect of metformin (1, 2, 5, and 10 mmol/L) on the expression levels of α-SMA, collagen type I, and fibronectin (FN) were measured by Western blot (aP < 0.05 vs the control group, cP < 0.05 and dP < 0.01 vs the PDGF-BB only group); E: HSCs were treated with a series of concentrations ranging from 1 mmol/L to 100 mmol/L of metformin for 24 h, and the proliferation was measured by CCK-8 assays. HSCs: Hepatic stellate cells.
