
Figure 3.
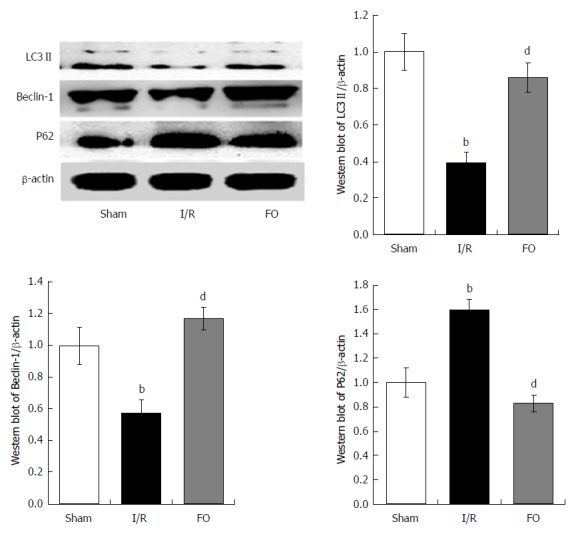
Western blot analysis of liver autophagy (LC3 II, Beclin-1, and P62) levels in different groups (mean ± SD, n = 8). bP < 0.01 vs sham group; dP < 0.01 vs I/R group.
Official websites use .gov
A
.gov website belongs to an official
government organization in the United States.
Secure .gov websites use HTTPS
A lock (
) or https:// means you've safely
connected to the .gov website. Share sensitive
information only on official, secure websites.
Western blot analysis of liver autophagy (LC3 II, Beclin-1, and P62) levels in different groups (mean ± SD, n = 8). bP < 0.01 vs sham group; dP < 0.01 vs I/R group.