
Figure 5.
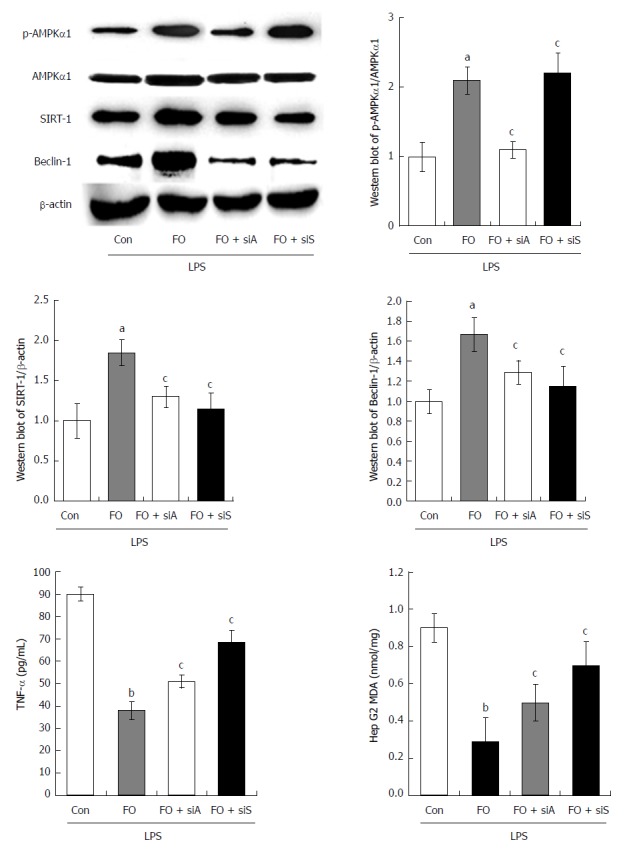
p-AMPK, AMPK, SIRT-1, Beclin-1, TNF-α, and MDA expression in HepG2 cells challenged with LPS, LPS + FO, LPS + FO + siAMPK, or LPS + FO + siSIRT-1 (mean ± SD, n = 3). aP < 0.05, bP < 0.01 vs control; cP < 0.05 vs FO.
Official websites use .gov
A
.gov website belongs to an official
government organization in the United States.
Secure .gov websites use HTTPS
A lock (
) or https:// means you've safely
connected to the .gov website. Share sensitive
information only on official, secure websites.
p-AMPK, AMPK, SIRT-1, Beclin-1, TNF-α, and MDA expression in HepG2 cells challenged with LPS, LPS + FO, LPS + FO + siAMPK, or LPS + FO + siSIRT-1 (mean ± SD, n = 3). aP < 0.05, bP < 0.01 vs control; cP < 0.05 vs FO.