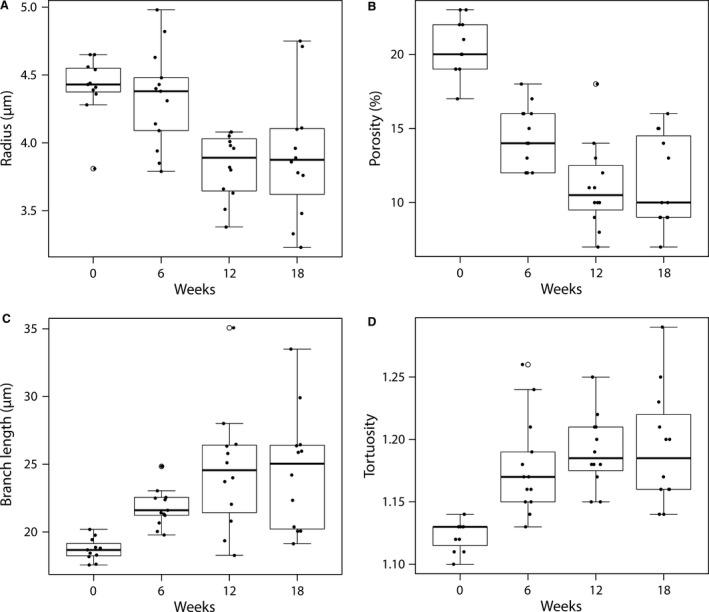
Figure 6.

Boxplots for (A) the radius, (B) the porosity, (C) the branch length, and (D) the tortuosity of the microcirculation as function of TAA intoxication time. The radius and porosity differed significantly between healthy (week 0) and cirrhotic livers (week 18; P < 0.05). Both parameters decreased gradually during the cirrhogenic progression, and as such contributed to the increased intrahepatic vascular resistance. On the other hand, the sinusoidal tortuosity and length increased only slightly, though still significantly, when going from healthy to cirrhotic livers.
