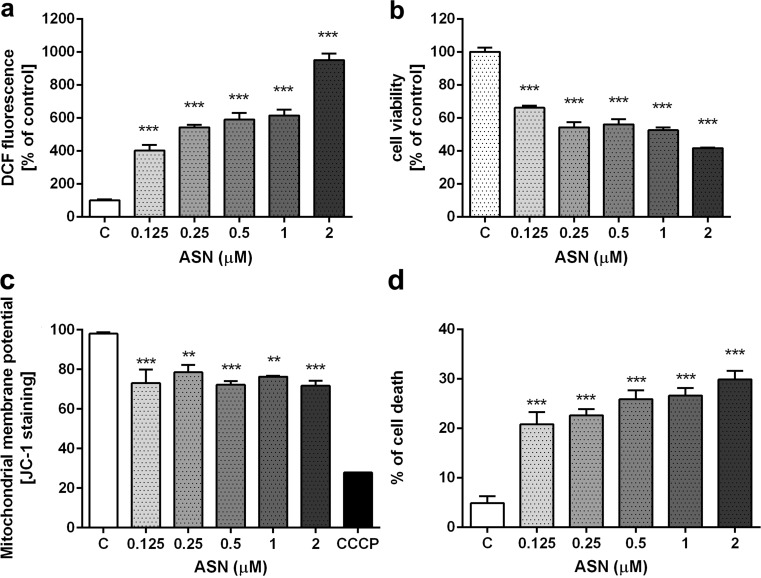
Fig. 2.
The effect of eASN on ROS generation, PC12 cells’ viability, mitochondrial membrane potential and cells’ death. PC12 cells were treated with 0,125–2 μM eASN for 48 h. ROS generation was determined using DCF probe (a), cell viability by MTT assay (b), mitochondrial membrane potential determined by JC-1 staining (c), cells’ death by Trypan Blue staining (d). Data represent the mean value ± S.E.M of four-six independent experiments with four to six replications. *p<0.05, **p<0.01 and ***p<0.001 versus control (phosphate buffer - treated PC12 cells) by one-way ANOVA followed by the Newman–Keuls post-hoc test.

