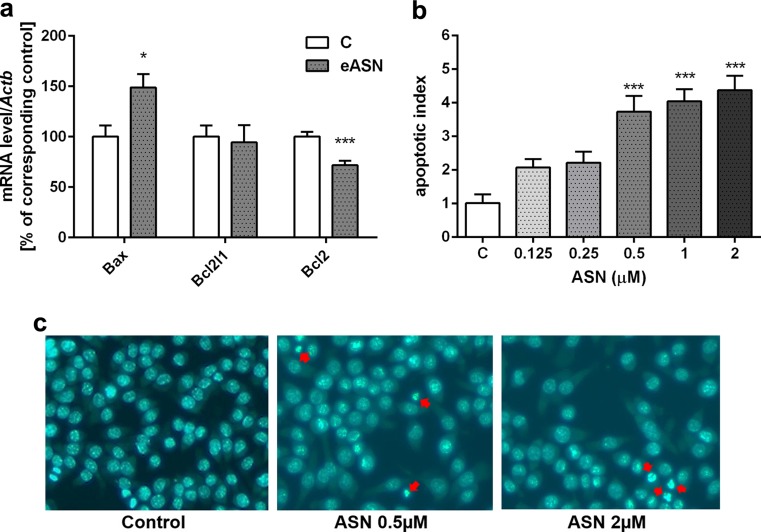
Fig. 7.
The effect of eASN on Bcl-2 pro-apoptotic and anti-apoptotic proteins gene expression and on apoptotic cells’ death. The mRNA level of Bax, Bcl2 and Bcl2-L1 after 24 h of 0,5 μM eASN treatment was measured with real-time PCR (a). The value expresses the fold of the above gene stimulation normalized against Actb (β-actin). Microscopic examination of cell nuclei, stained with DNA-binding fluorochrome Hoechst 33342. The cells were treated with 0,5 μM eASN, 24h. Cells with typical apoptotic nuclear morphology (nuclear shrinkage, chromatin condensation) were identified and counted. The results were expressed as percentages of apoptotic cells in the whole cells’ population from one exemplary experiment in four to eight replications (b,c). Data represent the mean value ± S.E.M of four – eight separate experiments with two replications. The relative level of mRNA was calculated by ΔΔCt method. **p<0.01 versus control(phosphate buffer -treated PC12 cells) by Student’s t-test

