Figure 1.
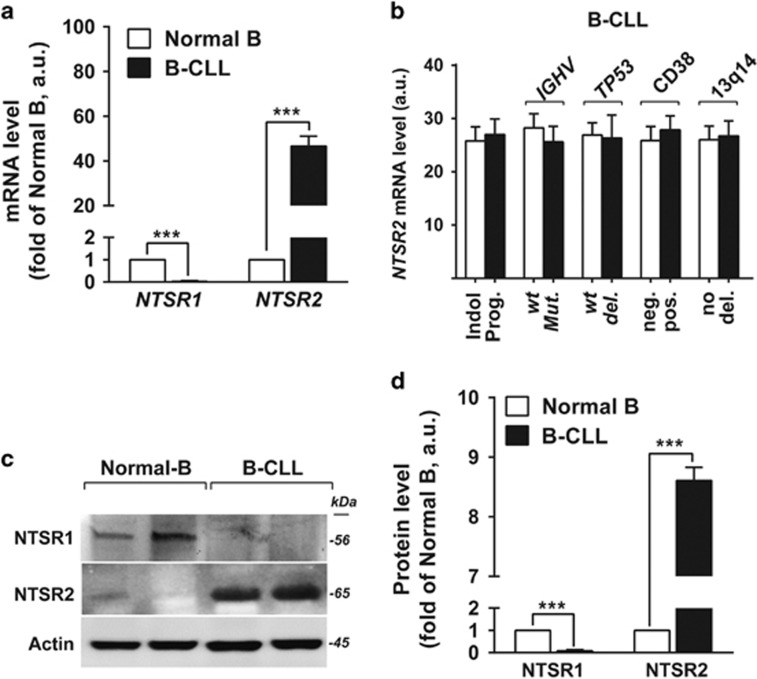
NTSR2, but not NTSR1, is overexpressed in B-CLL. (a) Quantitative analyses of NTSR1 and NTSR2 mRNA levels in normal B (n=15) and B-CLL (n=30) lymphocytes, normalized against HPRT. Data are expressed as mean fold change in expression (±s.e.m.) vs normal B cells. (b) Quantitative analyses of NTSR2 mRNA level in indolent (Indol.) vs progressive (prog.) patients, wild-type (wt) vs mutant (Mut.) IGHV, wild-type (wt) vs mutant (deleted, del.) p53, CD38 negative (neg.) vs positive (pos.), and absence (no) vs presence of 13q14 deletion (del.); values are given in arbitrary units (a.u.). (c) Representative analysis of NTSR2 expression from B-lymphocyte lysates from two normal donors (D1, D2) and two B-CLL patients (P1, P2). (d) NTSR2 expression, normalized against actin, in normal B (n=6) and B-CLL (n=6) lymphocytes (means±s.e.m. of three independent experiments). Significant P-values are indicated in the graphs ***P<0.001.

