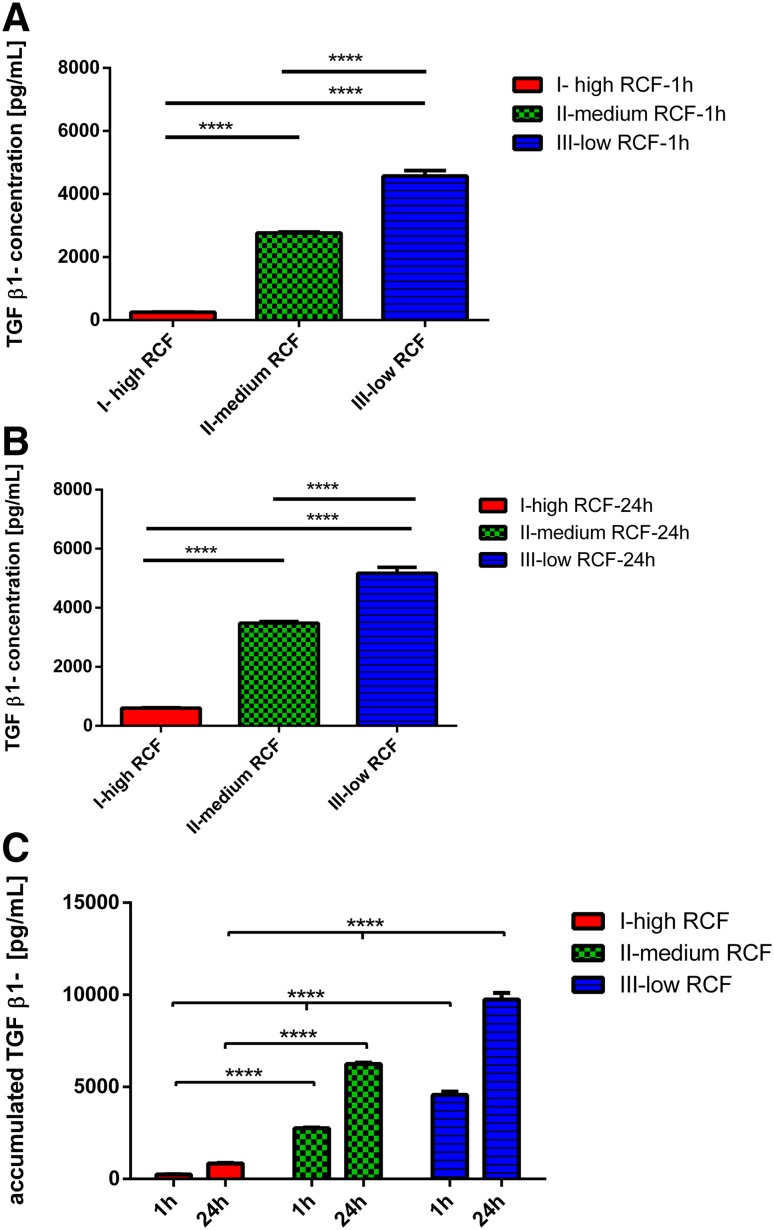
Fig. 4.
a TGF β-1 concentration within the different experimental PRF-based matrices 1 h after clotting. b TGF β-1 concentration within the different experimental PRF-based matrices 24 h after clotting. c Accumulated TGF β-1 concentration within the different experimental PRF-based matrices over 24 h

