Figure 7.
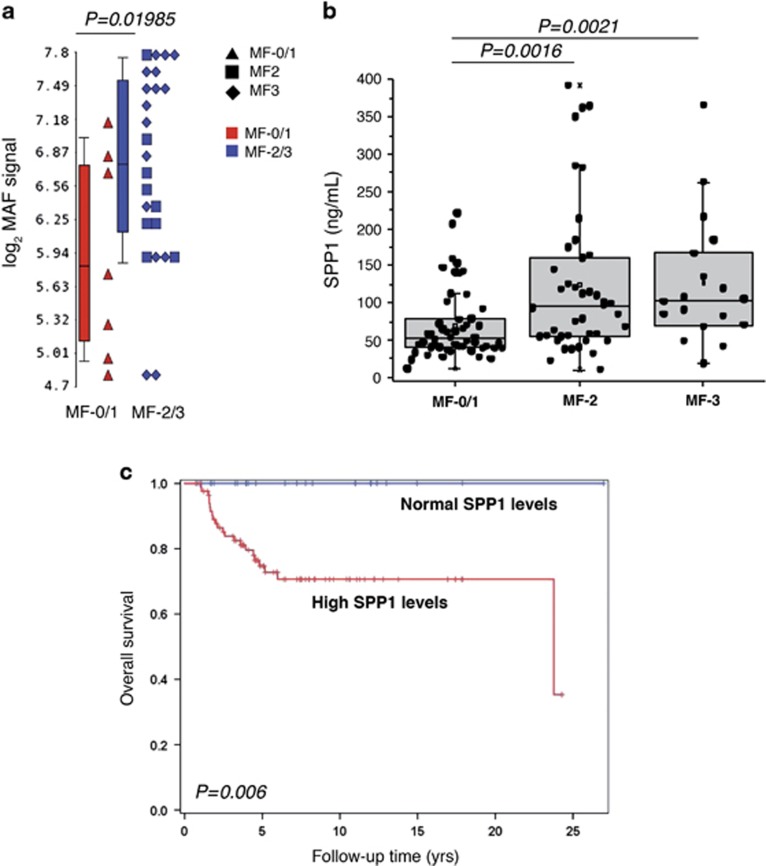
Clinical features of PMF patients according to MAF expression levels in CD34+ cells and SPP1 plasma levels. (a) MAF expression levels in CD34+ cells isolated from PMF patients at diagnosis according to the BM fibrosis stage they presented. Patients were divided in prefibrotic (MF-0/1, n=7) and overt fibrotic (MF-2, n=9 and MF-3, n=14) based on the BM fibrosis grading. Gene expression levels were measured by microarray analysis performed by Affymetrix platform as described in Norfo et al.8 MAF expression levels are reported as Robust Multiarray Analysis (RMA)-normalized log2 signals, which were obtained by using the Partek GS software. Boxes represent the interquartile range that contains 50% of the subjects, the horizontal line in the box marks the median, and bars show the range of values. The comparison between MF-0/1 and MF-2/3 groups was performed by using the Mann–Whitney U test. (b) Protein levels of SPP1 in the plasma of PMF patients (n=115) according to BM fibrosis grade. PMF patients were classified based on grade of fibrosis in prefibrotic (MF-0/1, n=54) and overt fibrotic (MF-2, n=43 and MF-3, n=18). Protein levels were measured by ELISA and are expressed as ng/ml. Plasma levels of SPP1 are shown as dot plots. Boxes represent the interquartile range that contains 50% of the subjects, the horizontal line in the box marks the median, and the bars show the range of values. Comparisons between two groups were performed by using the Mann–Whitney U test. (c) Kaplan–Meier estimates of overall survival in 115 patients with PMF, stratified by the plasma levels of SPP1. Patients with SPP1 plasma levels greater than the median value observed in the plasma of HDs were considered patients with high SPP1 levels. BM, bone marrow; ELISA, enzyme-linked immunosorbent assay; HDs, healthy donors; MF, myelofibrosis; PMF, primary myelofibrosis; n, number of samples.

