Figure 1.
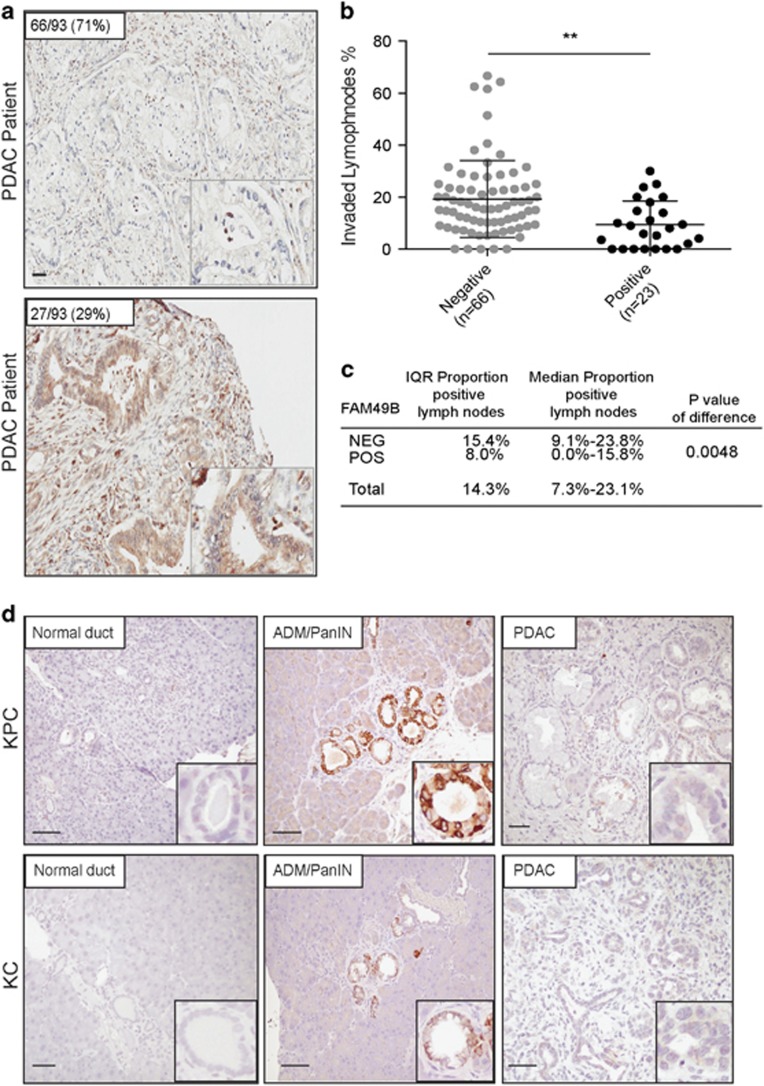
FAM49B expression in PDAC and its correlation with LN invasion (a) Representative sections of tumors showing positive and negative immunostaining for FAM49B. The scale bars represent a 100-μm inset, × 600 magnification. (b) LN metastasis percentage in PDAC patients with positive and negative FAM49B expression. (c) Comparison of the proportions of a total of 89 patients with positive (n=23) and negative (n=65) FAM49B expression and positive lymph nodes. The results were analyzed with the Mann–Whitney U-test. (d) Representative sections of different grading derived from the PDAC GEM mouse models (LSL-KrasG12D/+, Pdx-1-Cre (KC); LSL- KrasG12D/+, LSL-Tp53R172H/+ and Pdx-1-Cre (KPC)) at different ages 3, 6, 9 and 12 months (n=8/age). The scale bar represents 100-μm.

