Figure 3.
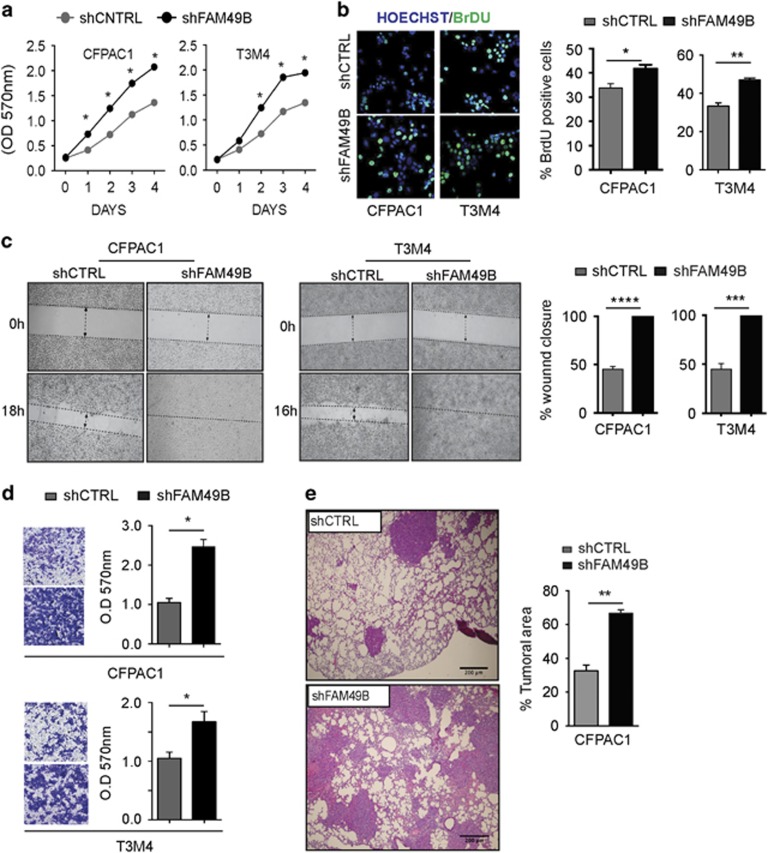
FAM49B functions as a metastasis suppressor. (a) shCTRL (gray circles) and shFAM49B (black circles) CFPAC1 and T3M4 cell proliferation was evaluated by MTT assay. The data are shown as the mean±s.e.m. OD at 570 nm of three independent experiments. (b) BrdU staining (green) in shCTRL and shFAM49B CFPAC1 and T3M4 cells. Cell nuclei are stained with Hoechst (blue). The graphs in the right panel represent the results of the quantification of BrDU-positive cells, as determined by immunofluorescence analysis of shCTRL (gray bars) and shFAM49B (black bars) CFPAC1 and T3M4 cells. Data are shown as the mean±s.e.m. of three independent experiments. (c) Wound-healing assays of shCTRL and shFAM49B CFPAC1 and T3M4 cells. The dotted lines indicate the wound edge at 0 h. Migration of individual cells over 16–24 h was tracked using ImageJ. The results are represented as wound closure percentage bars representing the mean values±s.d. of three experiments. (d) Statistical analysis of the results of the Matrigel invasion assays of shCTRL and shFAM49B cells. The results are expressed as the mean±s.e.m. of three independent experiments. (e) Lung metastasis assay of CFPAC1 cells transfected with shCTRL or shFAM49B. Representative hematoxylin–eosin (H&E) images of the lung metastases are shown scale bar represents 200 μm. Tumor metastases were quantified in the histological sections, n=4 per group, by ImageJ. Student’s t-test was used to determine the significance of the differences between the groups (*P<0.05, **P<0.001, ***P<0.0001, Student’s t-test).

