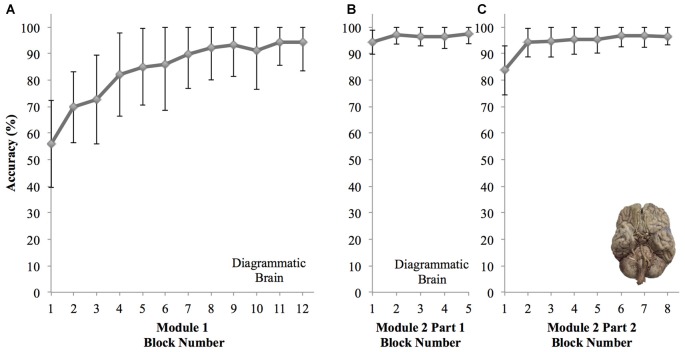
Figure 4.
Graphs showing changes in mean accuracy performance for each block of the reinforcement based learning computer modules for all participants (±SD). (A) Module 1—diagrammatic brain image used for 12 blocks showing novice learning. (B) Module 2 Part 1—diagrammatic brain image used for five blocks showing knowledge retention. (C) Module 2 Part 2—photo image of brain used for eight blocks showing transfer of knowledge.

