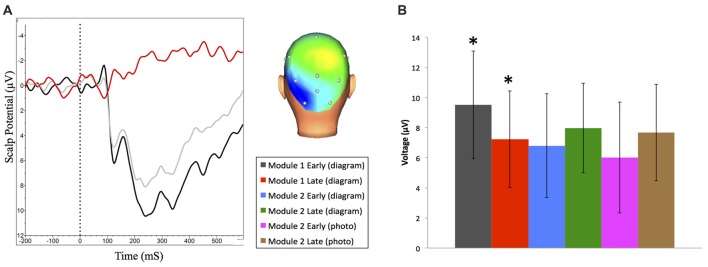
Figure 5.
(A) Grand averaged N250 event-related brain potential (ERP) waveforms at O1 and scalp distribution (between 230 ms and 330 ms) for early (dark) and late (light) trials during Module 1. ERP difference waveform (red) shows late minus early trials. Negative is plotted up. (B) Mean N250 amplitude (between 230 ms and 330 ms) at O1 across all learning events (±95% CI). *N250 amplitude significantly decreases during Module 1.

