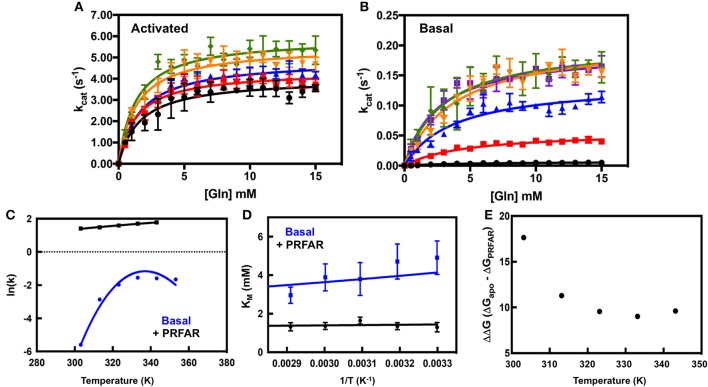
Figure 2.
Analysis of IGPS catalytic activity. Glutaminase profiles in the presence (A) and absence (B) of PRFAR were fit for Michaelis–Menten kinetic parameters and error bars are based on n ≥ 3 measurements and in some cases are smaller than the size of the data point. Traces are color coded as follows: black (303 K), red (313 K), blue (323 K), orange (333 K), green (343 K), and purple (353 K, Basal). Corresponding Arrhenius plots from kinetic traces of activated and basal IGPS are shown in (C) and the temperature dependence of Km is shown in (D). The temperature driven changes in free energy (ΔΔG) between apo and PRFAR-bound IGPS are shown in (E) as a difference of (ΔG)apo – (ΔG)PRFAR obtained using the Eyring expression.

