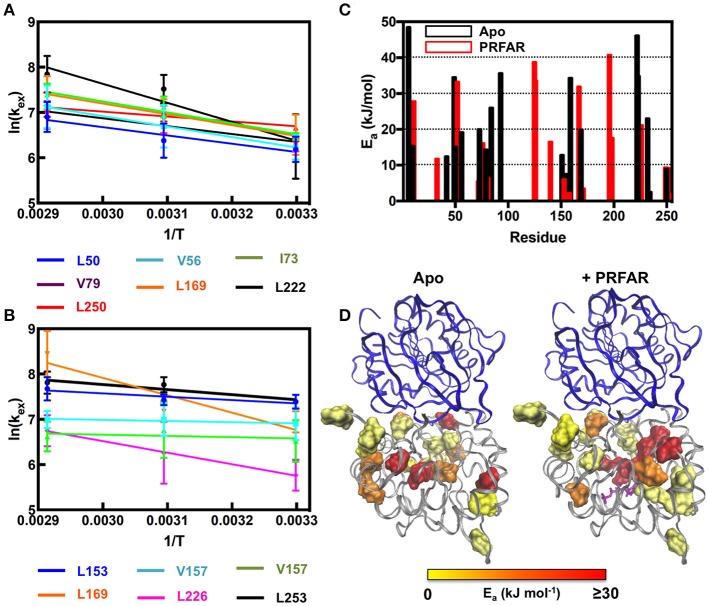
Figure 6.
Arrhenius plots for (A) apo and (B) PRFAR-bound IGPS based on temperature-dependent kex-values determined from NMR relaxation dispersion experiments. kex-values were determined from simultaneous fitting of single residue relaxation data obtained at 800 and 600 MHz. A summary of activation energies determined from fitting NMR relaxation data to the Arrhenius equation (data at three temperatures) or the integrated form of the Arrhenius equation (data at two temperatures) is shown in (C) and the resulting values are mapped onto the IGPS structure in (D).

