
Figure 4.
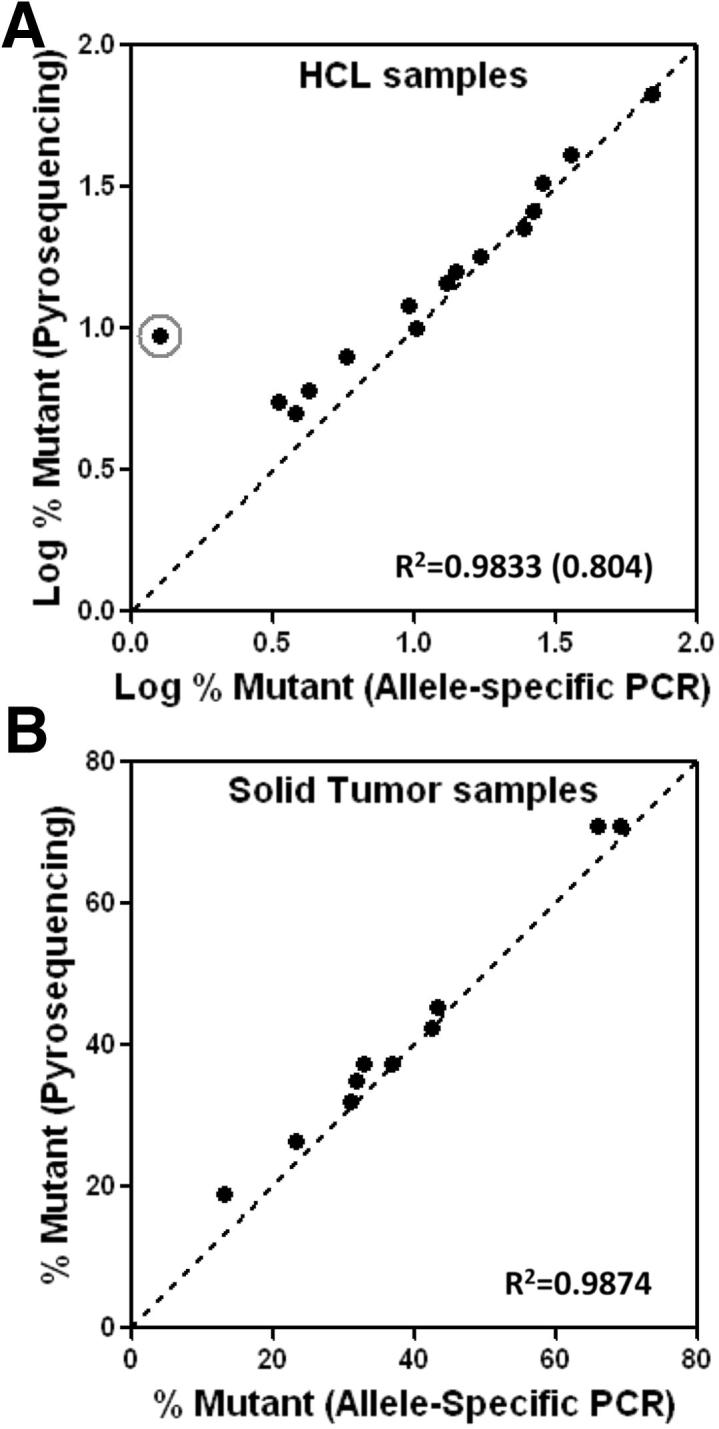
Comparison of quantitation with the pBRAF-HET calibrator plasmid to pyrosequencing. Comparison of allele quantitation by allele-specific PCR and pyrosequencing for HCL specimens with R2 values shown without (and with) the circled discordant HCL case (A) and solid tumor specimens that were within the range of positivity (≥5% mutant allele) by pyrosequencing with R2 values shown (B).