Figure 2.

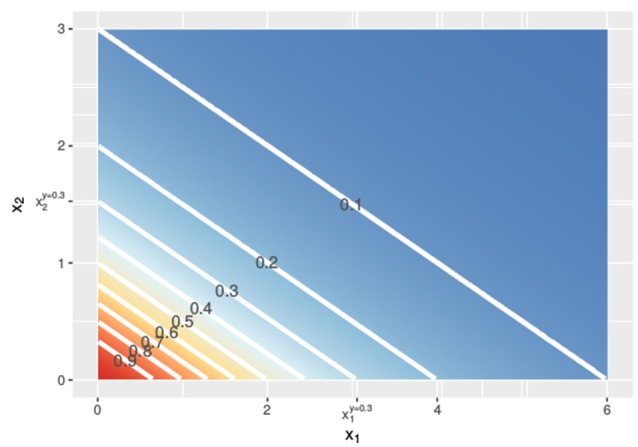
Contour lines of the response surface from Equations (3), (6), or (7) with x1 on the x-axis and x2 on the y-axis at linear concentrations.

Contour lines of the response surface from Equations (3), (6), or (7) with x1 on the x-axis and x2 on the y-axis at linear concentrations.