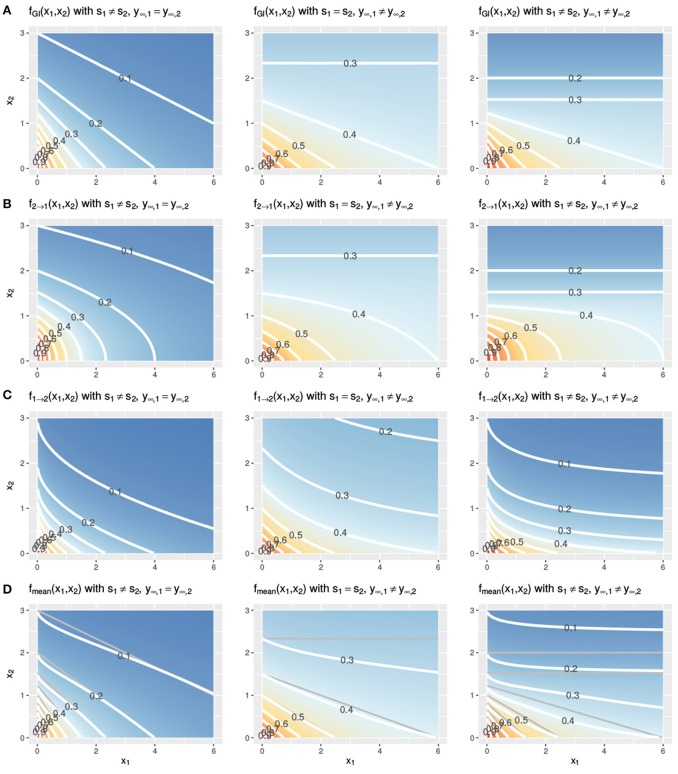
Figure 4.
Three cases of violation of the LACC for the fGI(x1, x2) (A), f2→1(x1, x2) (B), f1→2(x1, x2) (C), and fmean(x1, x2) (D) model. Contour lines are depicted in white. In (D) the contour lines of the corresponding fGI(x1, x2) are depicted in gray for reference. The parameter setting is the following from left to right: (left) s1 ≠ s2, here depicted with s1 = 1, s2 = 2, y∞ = 0, or (middle) the maximal effect values differ, y∞, 1 ≠ y∞, 2, here shown with s = 1, y∞, 1 = 0.3, y∞, 2 = 0 or (right) both, the slopes and the maximal effects are different, here shown with s1 = 1, s2 = 2, y∞, 1 = 0.3, y∞, 2 = 0. The remaining two parameters of the Hill curve are set equal for all figures to y0 = 1 and e = 1.

