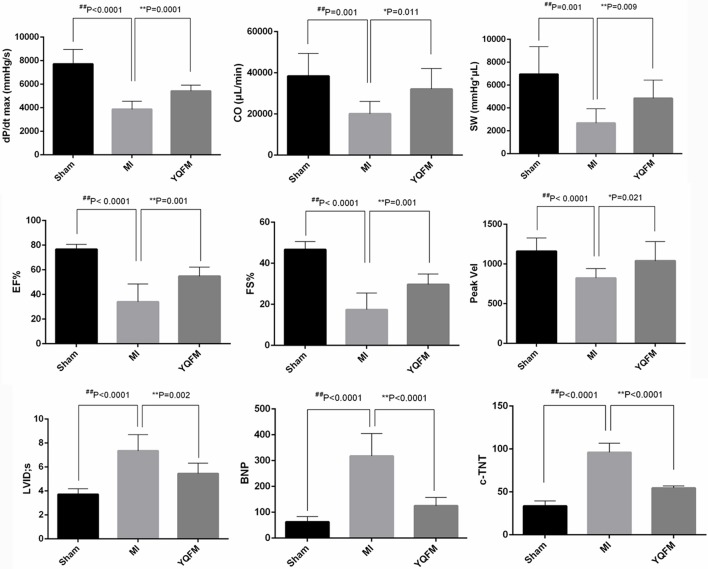
Figure 2.
Cardiac function evaluation with echocardiography detection (n = 10), left ventricular intubation evaluation (n = 8) and immunohistochemical examination (n = 8). All data are shown as the mean ± S.D. Unpaired Student t-test was performed. *P < 0.05, **P < 0.01, vs. MI group; ##P < 0.01 vs. Sham group.

