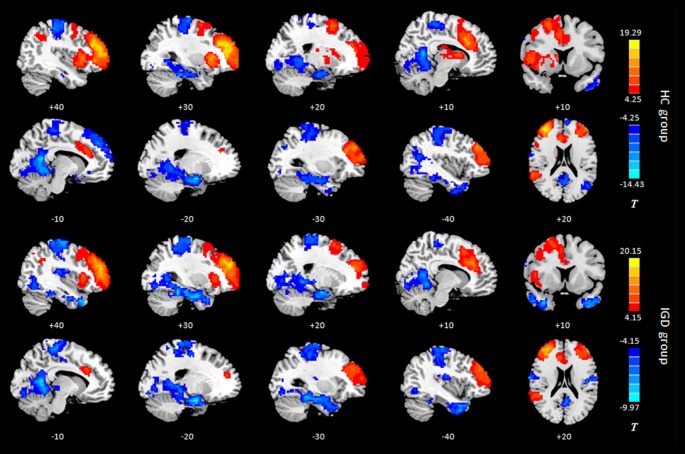
Figure 2.
Intragroup maps of connectivity to the right DLPFC of the resting-state networks. Significant connectivity regions are overlaid on the MNI template (p < 0.001, FDR-corrected). Color bar, yellow (orange): regions showing positive FC, blue: regions showing negative FC. HC, healthy control; IGD, internet gaming disorder. DLPFC, dorsolateral prefrontal cortex; MNI, Montreal Neurological Institute.

