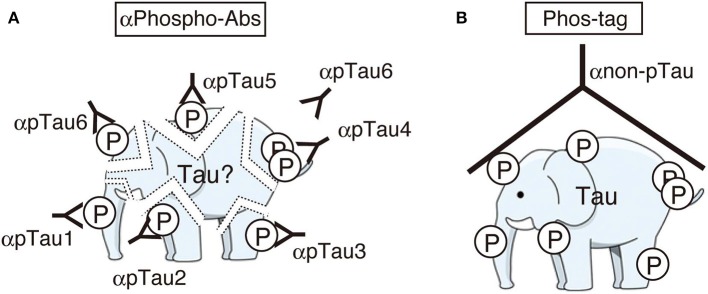
Figure 3.
Cartoons representing the images of immunoblotting with many phospho-specific antibodies (A) and a phosphorylation-independent single antibody after Phos-tag SDS-PAGE (B). Phosphospecific antibodies detect only part of phosphorylation at each site and some sites can be masked by another phosphorylated site nearby (here the site for αpTau6 is masked by a phosphorylated site which reacts with αpTau4). Phos-tag shows the whole phosphorylation profile at once. An illustration of an elephant was downloaded from the free illustration site at: http://illpop.com/png_animalhtm/elephant_a04.htm.

