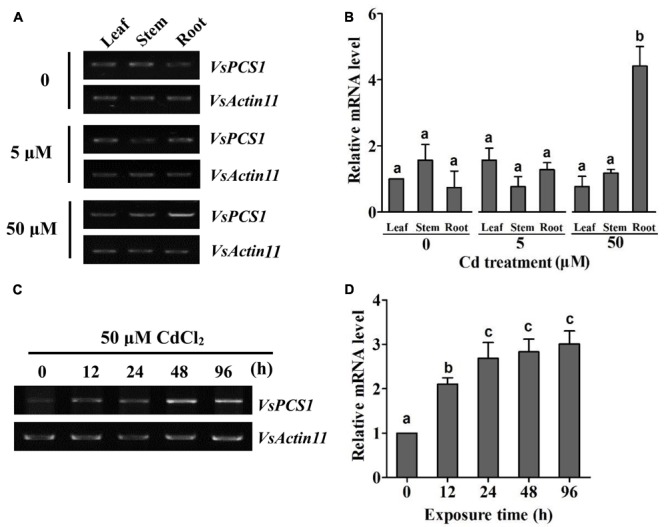
FIGURE 2.

Expression analysis of VsPCS1 in V. sativa. RT-PCR (A) and quantitative RT-PCR (B) analysis the expression level of VsPCS1 in different organs (roots, stems, and leaves) of V. sativa under Cd treatment. RT-PCR (C) and quantitative RT-PCR (D) analysis the expression level of VsPCS1 under 50 μM Cd treatment for different time in roots of V. sativa. VsActin11 was used as an internal control. Values are means ± SD of three biological replicates. Columns labeled with distinct lowercase letters indicate statistically significant differences among treatments (P ≤ 0.05).
