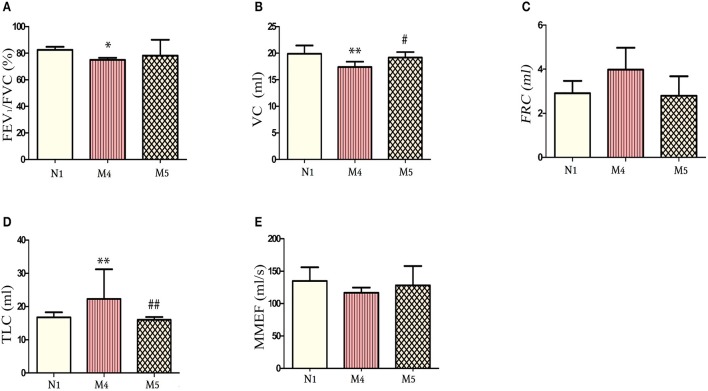
Figure 3.
Comparison of lung function indicators between the normal group and the 12-week cigarette smoke (CS) exposure group and the 8-week CS exposure + 4-week CS exposure cessation group. (A) The FEV1/FVC ratio at 12 weeks in the normal group, M4 group, and M5 group. (B) The vital capacity (VC) at 12 weeks in the normal group, M4 group, and M5 group. (C) The FRC at 12 weeks in the normal group, M4 group, and M5 group. (D) The TLC at 12 weeks in the normal group, M4 group, and M5 group. (E) The MMEF at 12 weeks in the normal group, M4 group, and M5 group. The data are presented as the mean ± the standard error of the mean (SEM).*p < 0.05 and **p < 0.01 indicate a statistically significant difference compared to the control group N1.#p < 0.05 and ##p < 0.01 indicates a statistically significant difference compared to the M4 group. FEV1, forced expiratory volume in 1 second; FRC, functional residual capacity; FVC, forced vital capacity; MMEF, maximal mild expiratory flow; TLC, total lung capacity.

