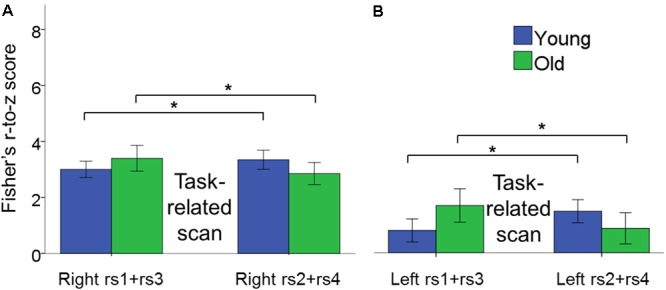
FIGURE 7.

Bar plots show the age × scan location interaction effect for intra-hemispheric functional connectivity. (A) Changes in connectivity in right hemisphere pairs of regions. (B) Changes in connectivity in left hemisphere pairs of regions. In both cases, functional connectivity increased after task performance in YA, whereas it decreased after task performance in OA within pre- and post-test sessions. Error bars represent SEM.
