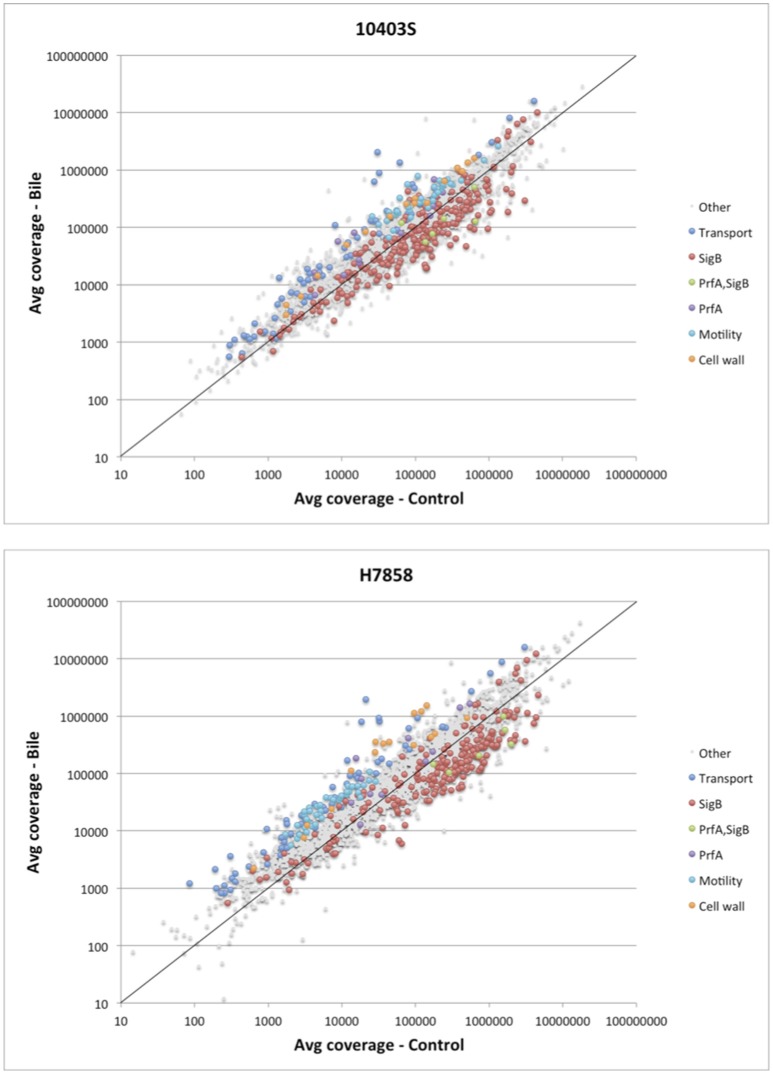
Figure 2.
Analysis of differential expression on the RNA-seq data of L. monocytogenes exposed to pH 5.5 with and without bile. Scatterplot representing the average expression level of genes exposed to pH 5.5 with bile (Y axis) vs. without bile (X axis) in L. monocytogenes 10403S (Top) and H7858 (Bottom). The known regulons of SigB and PrfA are labeled, as well as the significantly upregulated genes belonging to transport, cell wall, and motility related functions. The x = y line is shown in solid black, indicating a ratio of one (non-differentially expressed).

