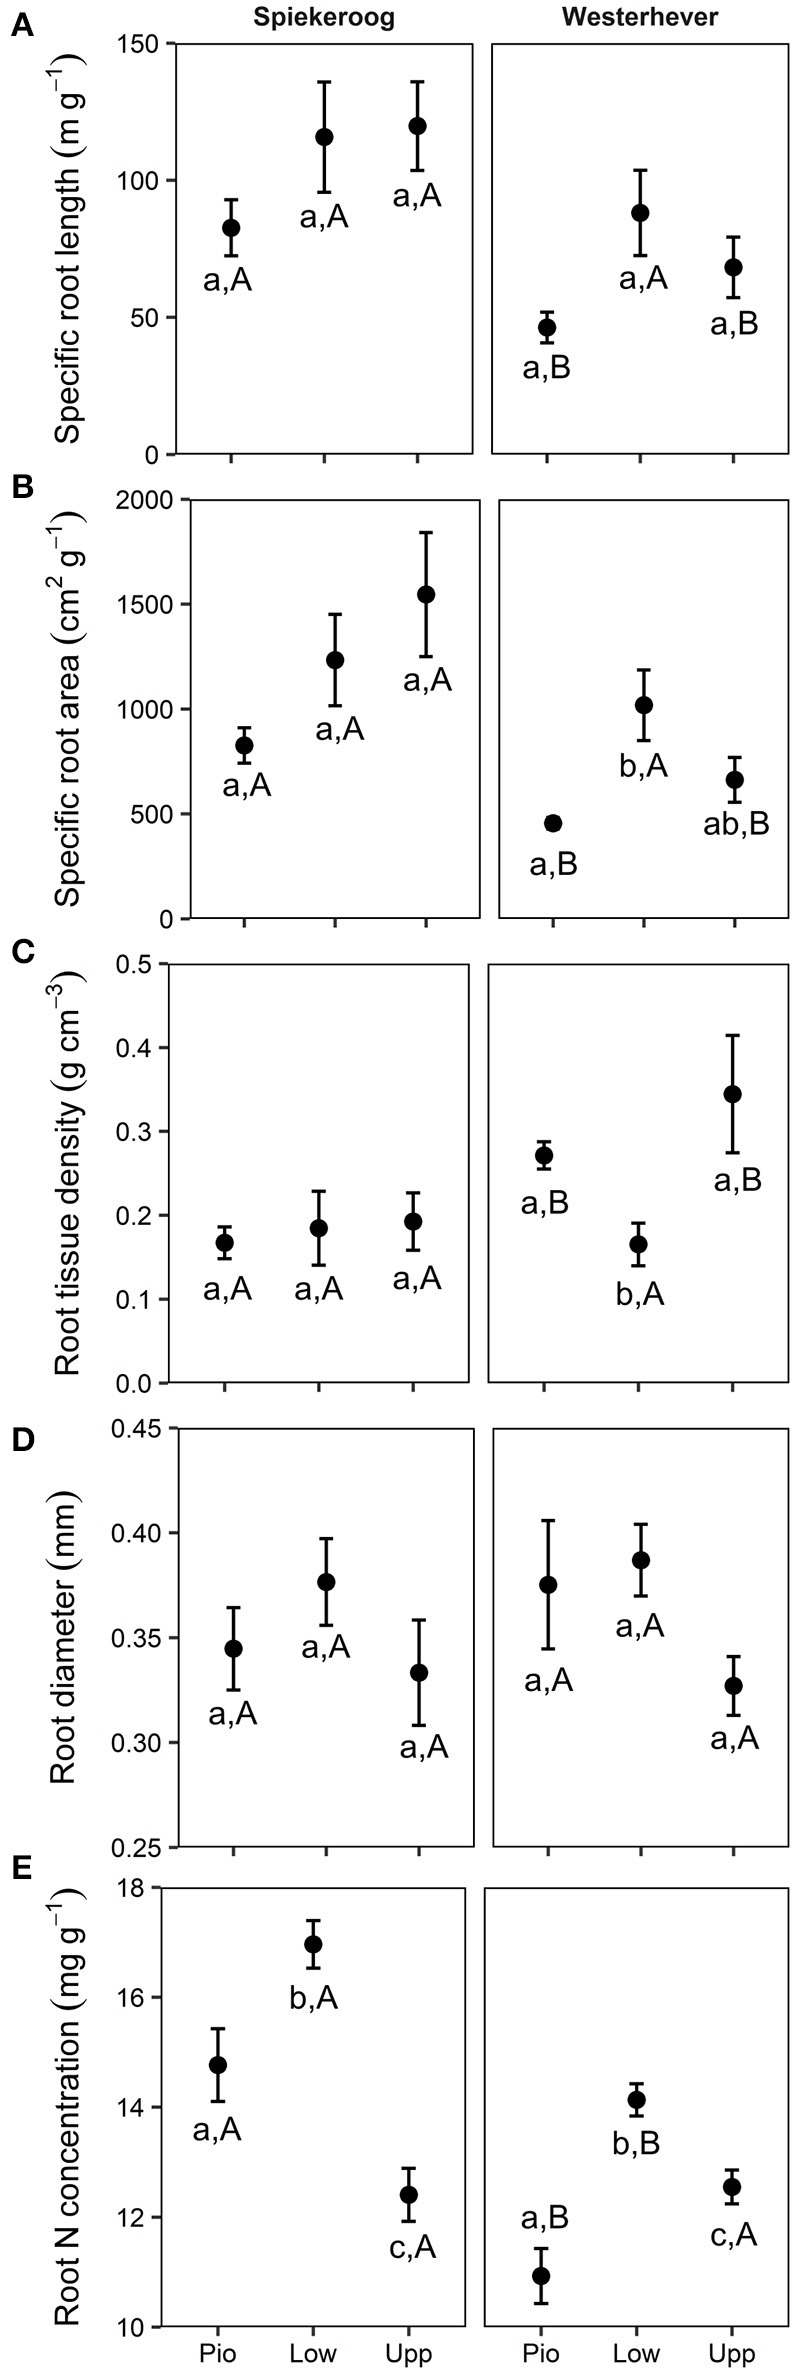
Figure 5.

Means ± SE of five fine root morphological traits (A, Specific root length; B, Specific root area; C, Root tissue density; D, Root diameter; E, Root N concentration) in the three saltmarsh communities (Pio, pioneer zone; Low, lower salt marsh; Upp, upper salt marsh) at the study sites Spiekeroog and Westerhever (n = 24). Different letters indicate significant differences between study sites and saltmarsh communities according to one-way ANOVA with Tukey's post-hoc test (p < 0.05).
