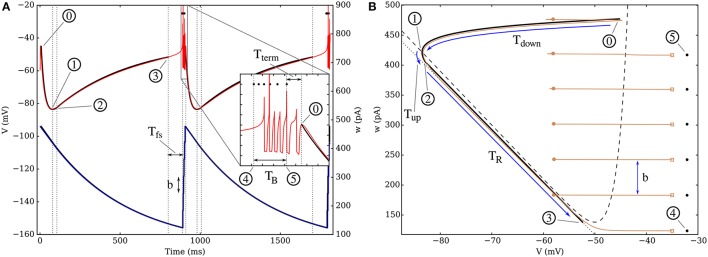
Figure 4.
(A) Time evolution of parameters V and w for the theoretical model (thick black lines and circled numbers) and for a simulation (thin red curve for V, blue for w) on a fixed in-degree graph with k = 100. Two bursts are represented and the intraburst dynamics is presented in the inset, where the spike times predicted by the equivalent model are marked by black dots. The numbered circles mark the main points of the theoretical dynamics, where the behavior changes, as described in the SI. (B) Plot of the attractors in phase space, both for the theoretical model (thick black curve), and through a simulation (thin brown). The three first periods following a burst are denoted by blue arrows: there is first a sharp decrease of V down to its minimum value as it crosses the V-nullcline (dashes); it is followed by a short interval where the neuronal state moves rapidly toward the “recovery curve” (dotted line), which is then followed until the minimum of the V-nullcline and the bursting sequence. The spike trajectory is cut on the figure (marked by empty squares) and the following reset point is marked by a filled circle, as the voltage is set back to Vr and w is increased by b. Neuronal and synaptic parameters are detailed in Table S1, Set 1. The w-nullcline is outside the range of (B).

